
Creating clear and objective reports and dashboards is essential to facilitate data analysis and optimize decision-making. In Reportei, you can highlight relevant information so that your clients or team can quickly understand the most important points.
1 Use the functionality of Metric Highlight
The functionality of Metric Highlight allows you to highlight strategic numbers within reports and dashboards. You can use it to highlight essential KPIs such as
- Number of conversions
- Amount invested
- ROAS
How to highlight a metric
- In your report or dashboard, locate the desired metric.
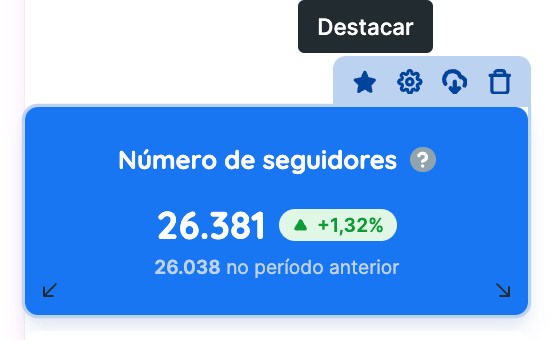
- Hover over the metric.
- Click on the star icon so it appears highlighted.
2 Customize the theme of the Reports
Good visual organization makes all the difference. In Reportei, you can customize
- Theme colors Use a palette that highlights the most relevant information.
- Order of sections/networks Organize the data in a logical sequence and prioritize the most important information at the top of the report
- Images and links Use visual resources to facilitate data interpretation.
3 Use the vertical funnel for better data comprehension.
If you want to highlight the customer journey within the sales funnel, you can use the Vertical Funnel which is now available to be added in reports and dashboards. It helps to better visualize the flow of conversions and bottlenecks.
How to add a Vertical Funnel
- Within your report or dashboard, click on Add metric;
- In the sidebar, select the option of Customizable Metrics and drag the option of Funnel to the data block.
- Choose between Horizontal Funnel or Vertical Funnel;
- Add the steps as needed.
- Customize the colors and finalize the configuration.


4 Use calculated metrics to create custom indicators.
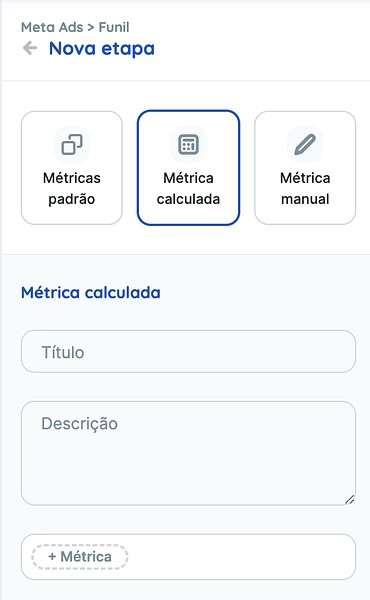
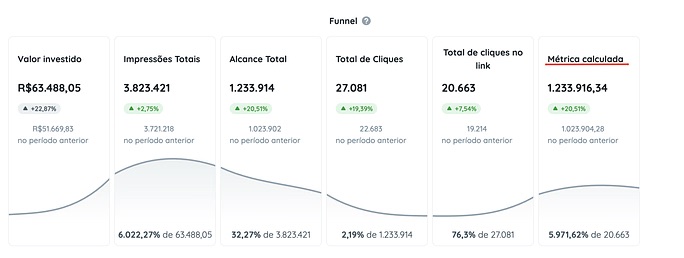
Now it’s possible to add Calculated Metrics within the funnels. This allows you to create exclusive indicators by combining different metrics to obtain a more detailed view of campaign performance.
Example
- Conversion rate: (Number of conversions / Total clicks) × 100
- Total Engagement Sum of likes, comments, and shares
With these functionalities of Reportei, you can create more visual, organized, and strategic reports and dashboards. This makes data analysis more efficient and improves result communication with clients and teams.
Try these tips right now and transform your reports into powerful insight tools.
If you have any questions, contact our Support team. =)