RD Station Reports
Follow the results of your Inbound Marketing strategy with RD Station reports from Reportei
Companies that trust Reportei


No more wasting time!
Now it’s even easier to measure the return of the Inbound Marketing strategies developed for your company or your customers!
With the RD Station report integrated with Reportei, your team develops complete analyzes and uses this data to plan more effective actions in future campaigns.
In addition, you have a series of important features that make communication with your client even clearer and more practical, such as: customizing templates for your reports, adding or removing metrics according to what is essential for the your project; additions of analyzes (in texts, videos and photos) to complement the information with your view on the results; development of a Timeline that counts, in chronological order, each step planned and executed in its strategy.
With reportei you have all the necessary tools to create reports that assist both in improving your strategy and in aligning objectives with your customers!
Generate RD Station reports in a few clicks
See how easy it is to stay on top of the results obtained on RD Station. Generate your RD Station reports now and check all the details of Reportei up close!
What metrics can I analyze in the RD Station report?
The RD Station report (for the moment only available for the Pro version of the platform) has the main metrics to evaluate your leads, where they came from and the conversions carried out during the analyzed period. They are:
Alcance
Impressões
Avançar
Voltar
Saídas
And even more!
From these general data about the performance of your Inbound Marketing actions, you can also check five tables that show the process that these Leads went through to reach your company:
- Table of the main sources of the last conversions;
- Main identifiers of the last conversions;
- Main Leads conversion tags;
- Conversions based on the note of interest;
- Lead Scoring based conversions.
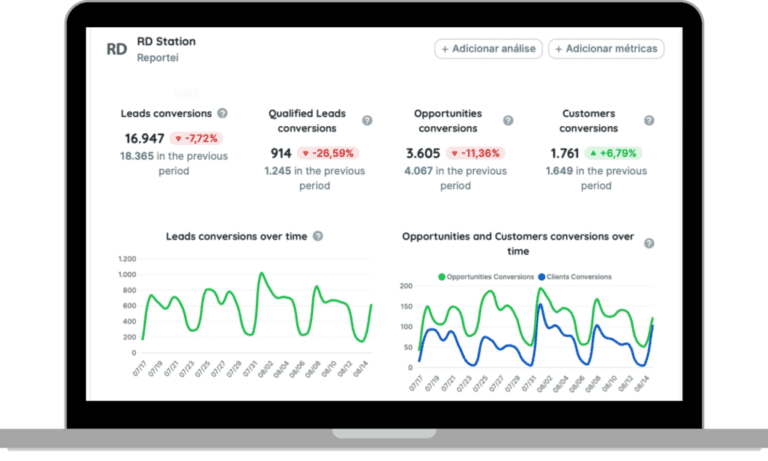
There are also two charts that show comparisons for you to understand in more detail the success of your strategy: that of Conversions of leads over time and that of Conversions of opportunities and customers over time.
An exclusive report from Reportei
Yes! Outside the platform itself, the RD Station report is a feature only of Reportei.
With the integration of your RD account with our tool, you can import all data quickly (in just three seconds) and can align the results with those of other social media.
After all, every Inbound Marketing strategy is made up of different content formats and distribution channels. That is, you can analyze the performance from the actions taken to the top of the funnel to the conversion into customers!
With that you win because you have more practicality on a daily basis and a saving of time that allows you to focus on what really matters: the product or service you deliver.
It is also possible to generate even closer contact with customers / decision makers in your agency or company, so that they understand not only the final result, but also the whole process to reach that moment and the next steps for the future.
What are you waiting for? Use Reportei to generate RD Station reports and social media reports that are part of your strategy.
Reports from RD Station: Present data to your client in a more practical way
Present in the daily routine of more than 10,000 agencies, freelancers, traffic managers, and companies, Reportei allows you to generate unlimited, professional, and customized reports to facilitate the communication of results with your clients.
That’s why our RD Station report contains the most important information to demonstrate whether your strategy was successful or not, and which actions will be planned to achieve even better performance in the future.
To reflect the data in an objective and completely didactic way, you have some resources that adapt perfectly to your reality and that of your client, as described below:


Your benefits
- Add, remove, or reorder metrics according to project and decision-maker relevance;
- Add one or more analyses (with texts, videos, and photos) to each section of the report, if you want to interpret the data and explain in more detail any obtained result;
- Create a Timeline to visually display which actions were taken at each stage of a specific campaign and what results were achieved;
- Download the report in PDF version;
- Send the report to the client through a link;
- Send the report through WhatsApp.
In addition to RD Station reports, you can also generate reports for Instagram, Facebook and Facebook Ads, Google Analytics, Google Ads, YouTube, LinkedIn and LinkedIn Ads, Google Search Console, Google My Business, Mailchimp, and RD Station CRM. Find the perfect plan for your projects and generate comprehensive, customized, and objective reports for your clients!