
Customize your reports further by editing tables and charts. Open a report and click “Edit” on the table or chart you want to change.
Here are the options available for each format:
Charts
When you edit a chart, customization options appear in the left sidebar, including Chart type, Metrics and dimension, and Analysis period.
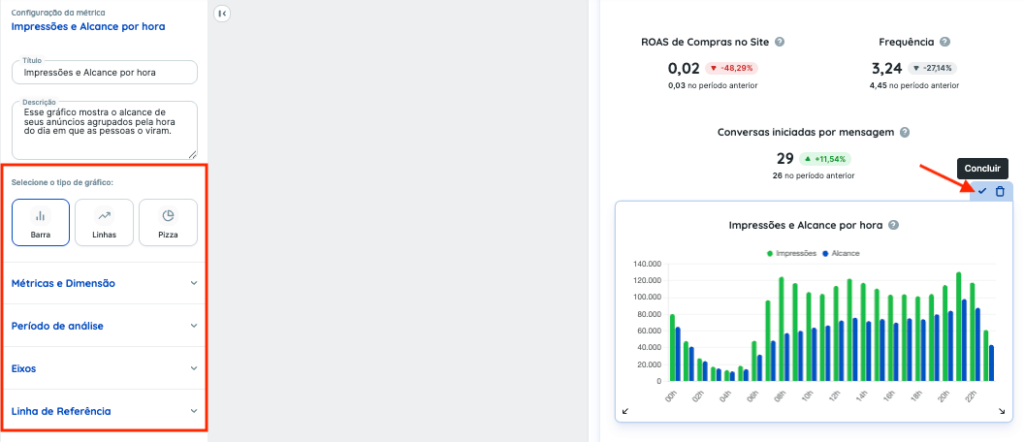
The Metrics option lets you add, replace, or remove a metric from the chart. The Dimension determines how values are grouped. In a Reach and Impressions by Hour chart, for example, Reach and Impressions are the series, and Hour is the dimension.
Open the metric selector to add another metric. Some combinations may not be valid or meaningful for the chart.
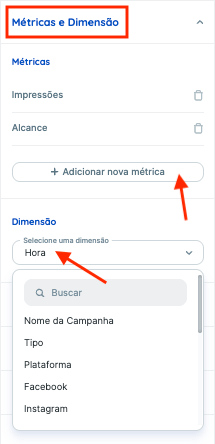
Similarly, click Change dimension to select from the available options.
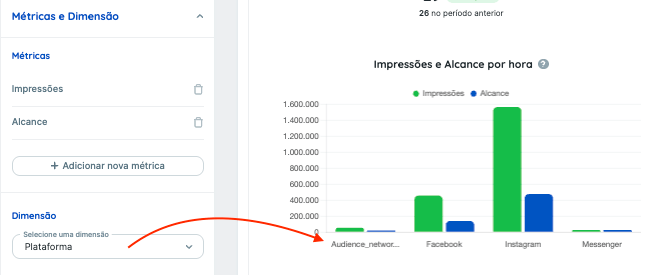
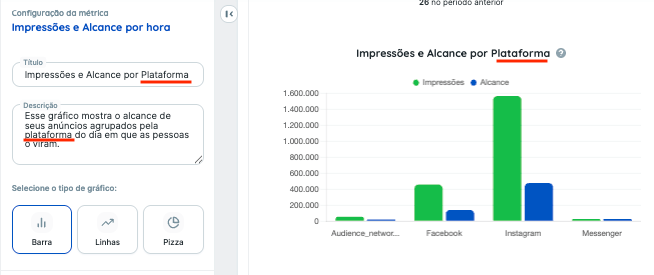
After making these changes, review the chart’s title and description and update them manually to match.
Tables
In addition to hiding rows and columns and setting the number of displayed rows, supported tables let you add columns and apply filters.
Click Edit table, as with charts, to see the available table settings:

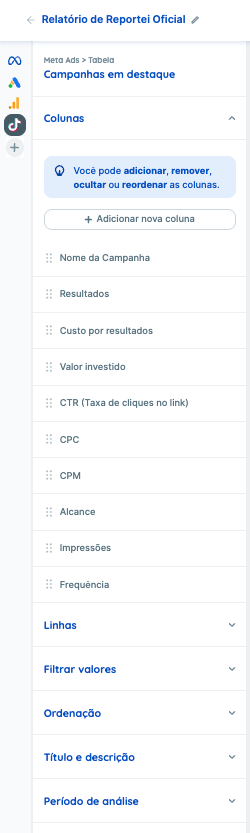
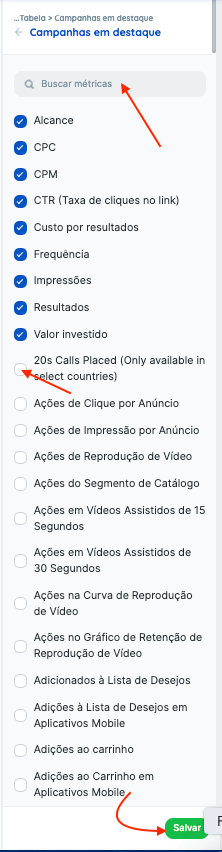
In Columns, add another column to include the information you need:
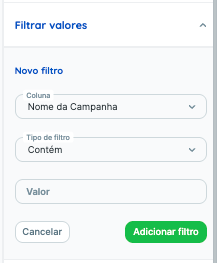
The Rows option still lets you hide information. Filters offer additional control over which data you analyze:
You can also update the title and description here.
Learn how to display a longer period in charts.
If you have questions, contact our Support team! =)