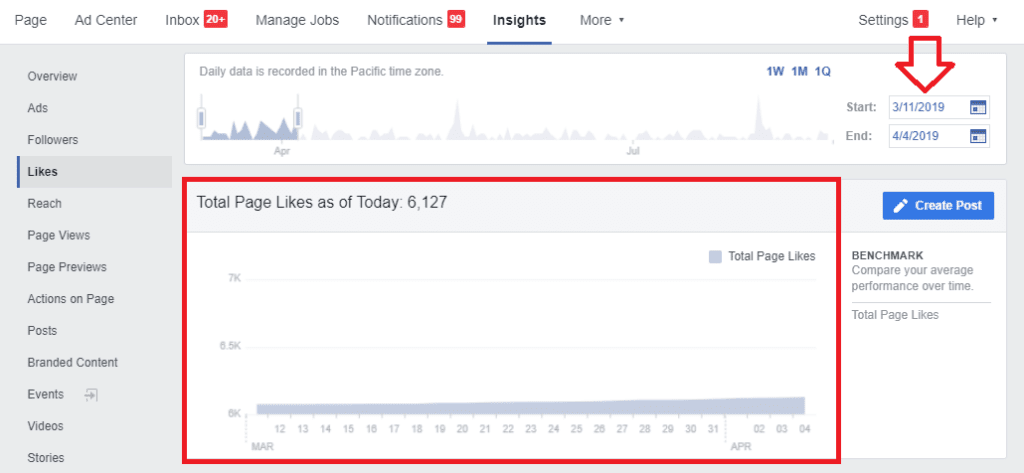
In the Reportei Facebook report you can see the New Likes metric. This data represents the net variation in the number of page likes in the period analyzed. This means that the metric is the net total of page likes on the last day of the reporting period minus the net total of page likes on the first day.
The information for this metric is extracted, as well as all other metrics, directly from the Facebook API. You can see from the “Total Page Likes” graph on Facebook Insigths that the variation of page likes from the first to the last day of the reporting period is equal to New Likes in the Reportei Facebook report.
Still talking about Likes, we also have the Likes Growth Graph in Reportei report. This graph is taken directly from the “Net Likes” chart, also available on the Facebook Insights page. In this chart you can see the organic and paid likes and the unlikes that the page had in the period.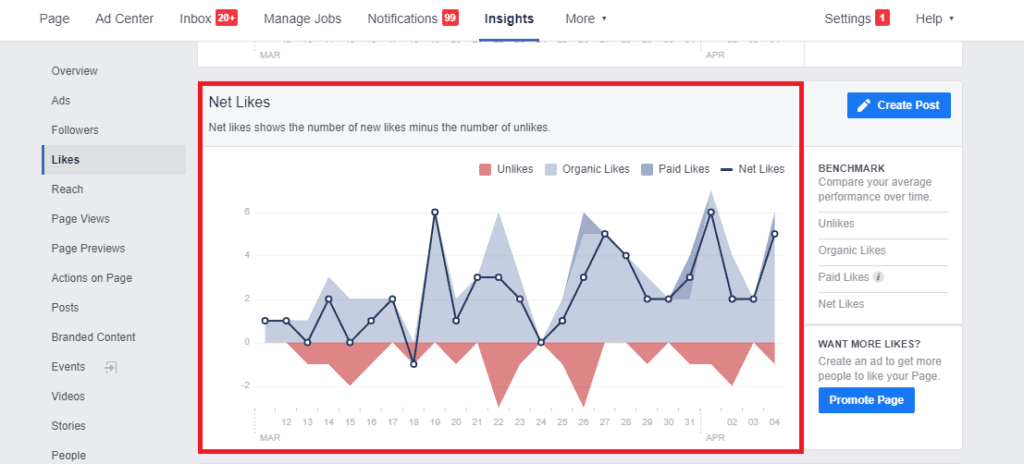
Although the metrics seem to be about the same thing (Page Likes) both metrics we explain here may differ if compared. But if we observe and compare each with the graph on Facebook where information is extracted, we see that the information is consistent.
Warning: Always remember to select the same time period analyzed in the Reportei report and Facebook Insights.