Reportei’s Dashboard
Speed up your analyses with our dynamic Social Media and Digital Marketing Dashboards
Companies that trust Reportei


No more wasting time!
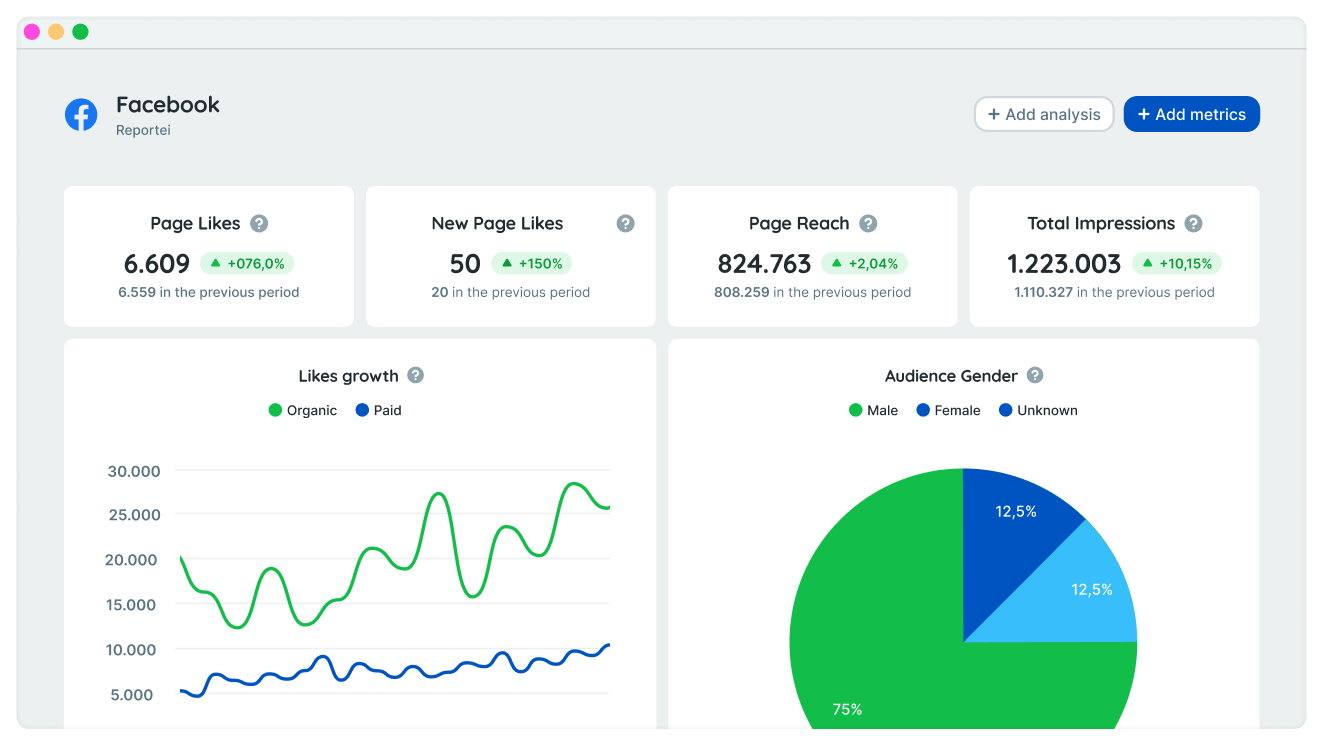
The idea behind our social media and digital marketing dashboards is to help you analyze your project results comprehensively and efficiently.
Our metrics dashboard contains the static report data, graphs, and tables, but you can also switch analysis and comparison periods anytime.
That means you can monitor all your data in one shot. No need to read through a bunch of reports every week, and you won’t have to wait till the end of the month to track your metrics. Quicker, more accurate decision-making is what we’re talking about.
Create as many dashboards as you’d like for your projects and select one to share with your client. That way, they can browse through metrics and closely monitor the results of your strategy.
Learn which social network metrics are available on the Reportei dashboard and how they can help you work smarter on the go!
Generate social media and digital marketing dashboards in just a few clicks
Our dedication to innovation, combined with a commitment to transparency and excellence, has earned us quality certifications and recognition awards in the digital marketing sector.


And that’s not all
Here are four extra benefits of using our social media dashboard.
Update metrics anytime
Whether you’re selecting specific data, or need an overview of all your social network data, you can switch analysis and comparison periods for the info you need in a flash. Nothing gets left out!
Make quicker decisions
Updating dashboards in Reportei and navigating data without having to generate more than one report also helps your team speed up decision-making.After all, the entire history of your network activity is sitting in one control panel, ready to help you plan more strategically.But keep in mind that you’ll only be able to process the metrics of some networks after you’ve integrated them (like RD Station and Instagram Stories).
Share data with your team and clients
One major advantage of using our dashboards is creating as many as you’d like, including one or more for your team or clients to easily track results for themselves. It encourages decision-makers to get more involved with projects. They won’t need to wait too long to look over the results of actions and can contribute helpful insights for the next steps.
Custom templates
You can customize our social networks dashboards, organizing channels, metrics, and graphs you’re using in projects in order of priority. You can also complement the data with your analysis as texts, videos, or images. That means you establish what needs following up. You can even save templates to use with the same client or others in your account.
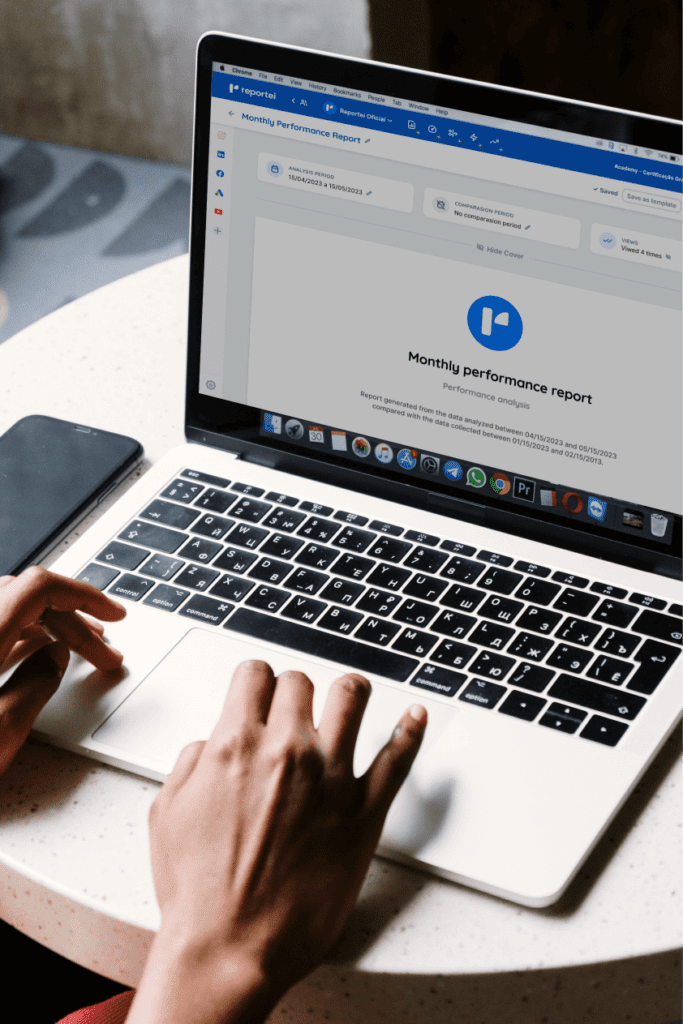
Dashboard vs Reportei Reports: What’s the difference?
Dashboards and reports are different tools that complement each other to make your team and client’s data analysis more complete, accurate, and relevant.
While static reports are about in-depth analysis to help you keep a record of your activity across different networks, dashboards update in real-time, helping speed up decision making.
Neither rules out the other! Much the opposite: using both makes for more strategic projects and smooth communication between your team and decision-makers.
Check out our plans to find the best for your business or agency now!
Dashboards: present data to your client in a more practical way
Present in the daily routines of over 10,000 agencies, freelancers, traffic managers, and companies, Reportei allows you to generate professional and customized dashboards to facilitate communication of results with your clients.
That’s why our dashboard contains the most important information to demonstrate whether your strategy was successful or not, and which actions will be planned to achieve even better performance in the future.
To present the data in an objective and highly didactic manner, you have access to several resources that perfectly adapt to your reality and that of your clients, as described below:

Your benefits
- Add, remove, or rearrange metrics according to what is most relevant for the project and the decision maker.
- Add one or more analyses (with texts, videos, and photos) to each topic of the report, in case you want to interpret the data and explain in more detail some obtained results.
- Create a Timeline to visually expose which actions were taken at each stage of a specific campaign and what results were achieved.
- Download the report in PDF version.
- Send the report to the client through a link.
- Send the report through WhatsApp.
In addition to dashboards, you can also generate reports and dashboards for Facebook and Facebook Ads, Google Analytics, Google Ads, YouTube, LinkedIn, LinkedIn Ads, Google Search Console, Google My Business, Mailchimp, and RD Station. Find the perfect plan for your projects and generate comprehensive, personalized, and objective reports for your clients!