LinkedIn Reports and LinkedIn Ads Reports
Boost your company page with the results of LinkedIn reports and LinkedIn Ads reports of Reportei
Companies that trust Reportei


No more wasting time!
The most important business social network in the world is also on Reportei!
Through our LinkedIn report, you follow the data on your company page and generate inputs to further leverage your results.
All of this without stress for your team and with a time saving that allows you to focus on what really matters: your content and ad strategies for the platform.
More than 4.000 agencies, freelancers and companies have already adopted Reportei as a tool to analyze social media metrics and make communication with customers more effective. Come join this team too!
Generate LinkedIn reports in a few clicks
Did you see how easy it is to stay on top of the results obtained on LinkedIn? Generate your LinkedIn reports now and check all the details of Reportei up close!
Check which metrics you find on LinkedIn
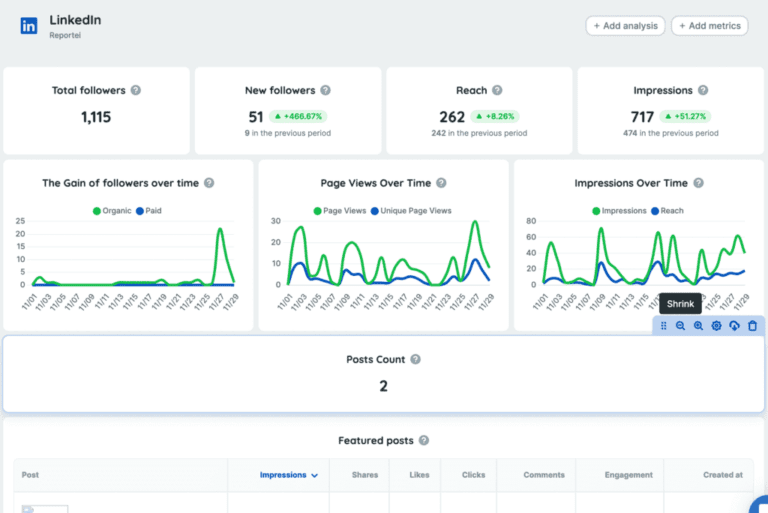
In LinkedIn report you find metrics that reveal the interaction with your audience and the amount of content generated during the analysis period.
Total followers
New followers
Reach
Impressions
Number of posts
And even more!
To further facilitate the tracking of results, there are two comparative charts about the above information:
- one with the gain of followers over time, which shows both the growth of organic and paid followers;
- and the other for impressions over time, which makes a comparison between this metric and the metric.
If your goal is to analyze the performance of your content we also provide a table of Featured Posts, which gathers data such as impressions, likes, clicks, shares, comments and engagement rate of the main posts of the period.
LinkedIn Ads Metrics
Go beyond the organic and go deeper into the return generated by the ads made on the platform. In the LinkedIn Ads report, you’ll see the following metrics:
Ads
Impressions
Ads
Clicks
Ads
Followers
Ads
Total engagement
Ads
Total likes
Ads
Shares
Ads
Total comments
Ads
Cost
In addition, you access two other comparison charts on the evolution of clicks and impressions during the analysis time.
The Featured Posts table also exists in this second report, but with the function of showing the impressions, clicks and total engagement of the ads that most impacted your audience.
Start right now to track the data that can leverage your Ads campaigns on the platform.
Reports from LinkedIn: Present data to your client in a more practical way
Present in the daily routine of more than 10,000 agencies, freelancers, traffic managers, and companies, Reportei allows you to generate unlimited, professional, and customized reports to facilitate the communication of results with your clients.
That’s why our LinkedIn report contains the most important information to demonstrate whether your strategy was successful or not, and which actions will be planned to achieve even better performance in the future.
To reflect the data in an objective and completely didactic way, you have some resources that adapt perfectly to your reality and that of your client, as described below:


Your benefits
- Add, remove, or reorder metrics according to project and decision-maker relevance;
- Add one or more analyses (with texts, videos, and photos) to each section of the report, if you want to interpret the data and explain in more detail any obtained result;
- Create a Timeline to visually display which actions were taken at each stage of a specific campaign and what results were achieved;
- Download the report in PDF version;
- Send the report to the client through a link;
- Send the report through WhatsApp.
In addition to LinkedIn reports, you can also generate reports for Instagram, Facebook and Facebook Ads, Google Analytics, Google Ads, YouTube, LinkedIn Ads, Google Search Console, Google My Business, Mailchimp, and RD Station. Find the perfect plan for your projects and generate comprehensive, customized, and objective reports for your clients!