Reports and Dashboards for TikTok and TikTok Ads
Optimize your TikTok Ads campaigns keeping all your key data on a single screen. Integrate your reports and dashboards with other digital marketing channels on Reportei!
Companies that trust Reportei


Generate TikTok Reports and dashboards in only 3 seconds with Reportei
Integrating TikTok and TikTok Ads with Reportei allows you to generate TikTok reports and dashboards in a matter of seconds! You can also access key metrics, performance graphs, and of course, individual campaign ad results.
You can analyze TikTok metrics and other channels on a single screen by integrating them with Reportei! It makes extracting insights all the more practical and helps you optimize planning and invest more efficiently.
Create reports and dashboards for TikTok Ads with a few simple clicks
Analyze your TikTok data right now and learn about how Reportei works in-depth!
Here are the top 12 metrics you’ll find in Reportei’s TikTok Ads reports and dashboards
After integrating your TikTok Ads account with Reportei, you can access your main results with a few easy clicks.
Here’s a list of the metrics you can track to analyze reach, views, costs, and more:
Impressions
Reach
Frequency
Video Views
Average Watch Time
Total Clicks
CTR (Click Through Rate)
Conversions
Total Cost
CPC (Cost Per Click)
CPM (Cost per Thousand)
CPA (Cost Per Action)
And even more!
There are four additional metrics for videos to help you gauge how users interact with your content. Check them out:
- Number of times that a video plays to 25% of its length (does not include replays);
- Number of times that a video plays to 50% of its length;
- Number of times that a video plays to 75% of its length;
- Number of times that a video plays to 100% of its length.
Plus, adding comparison periods to your reports and dashboards allows you to monitor results and follow numbers as they rise and fall. That gives you insight into what gets higher engagement on TikTok and what strategies to optimize.
Analyze performance graphs and tables for your TikTok Ads campaigns
Besides metrics, our TikTok Ads reports and dashboards automatically create graphs and tables you can use to track ad campaign data in depth.
Graphs will show costs, impressions, clicks, and conversions over time. And that’s not all! We have three additional graphs, breaking down impressions, age, platform, and gender.
Tables let you analyze campaign and featured ads results (cost, impressions, and conversions) and the countries and regions where you ran ads.
Extract valuable insight form TikTok Ads results
Besides metrics, our TikTok Ads reports and dashboards automatically create graphs and tables you can use to track ad campaign data in depth.
Graphs will show costs, impressions, clicks, and conversions over time. And that’s not all! We have three additional graphs, breaking down impressions, age, platform, and gender.
Tables let you analyze campaign and featured ads results (cost, impressions, and conversions) and the countries and regions where you ran ads.
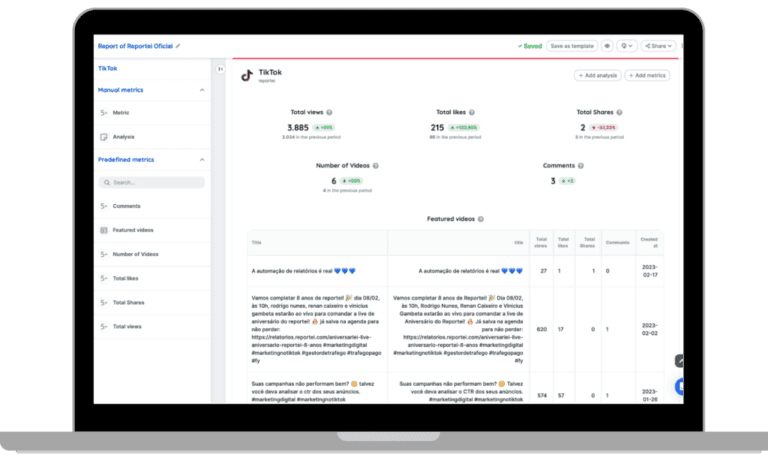
Here are the metrics available in Reportei’s TikTok reports and dashboards
A TikTok/Reportei account integration allows you to access your most relevant TikTok results with a few simple clicks.
You can analyze:
- Total views;
- Total likes;
- Total shares;
- Number of videos;
- Comments;
- Featured videos.
Reports from TikTok: Present data to your client in a more practical way
Present in the daily routine of more than 10,000 agencies, freelancers, traffic managers, and companies, Reportei allows you to generate unlimited, professional, and customized reports to facilitate the communication of results with your clients.
That’s why our TikTok report contains the most important information to demonstrate whether your strategy was successful or not, and which actions will be planned to achieve even better performance in the future.
To reflect the data in an objective and completely didactic way, you have some resources that adapt perfectly to your reality and that of your client, as described below:


Your benefits
- Add, remove, or reorder metrics according to project and decision-maker relevance;
- Add one or more analyses (with texts, videos, and photos) to each section of the report, if you want to interpret the data and explain in more detail any obtained result;
- Create a Timeline to visually display which actions were taken at each stage of a specific campaign and what results were achieved;
- Download the report in PDF version;
- Send the report to the client through a link;
- Send the report through WhatsApp.
In addition to TikTok reports, you can also generate reports for Instagram, Facebook and Facebook Ads, Google Analytics, Google Ads, YouTube, LinkedIn and LinkedIn Ads, Google Search Console, Google My Business, Mailchimp, and RD Station. Find the perfect plan for your projects and generate comprehensive, customized, and objective reports for your clients!