HubSpot Reports and Dashboards
Track the results of your Inbound Marketing strategy with Reportei’s HubSpot reports and dashboards
Companies That Trust Reportei


Stop Wasting Time!
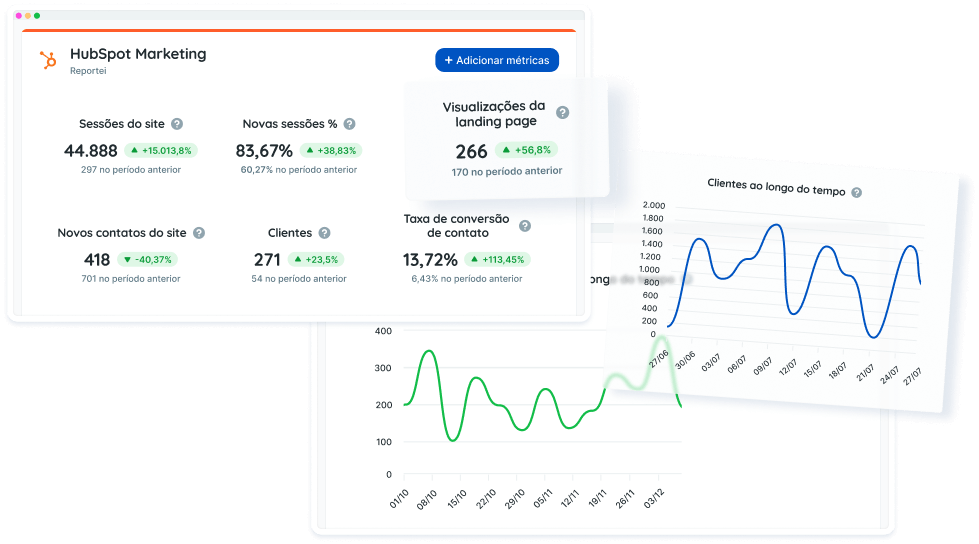
A fantastic new feature just added to Reportei are the HubSpot Marketing reports, which bring complete metrics to assist in a more precise analysis of your Inbound Marketing and Sales strategies.
Automatically and in a matter of seconds, our tool captures all the information and provides the necessary resources to facilitate data interpretation, insights gathering, and quicker decision-making.
Generate HubSpot reports and dashboards in just a few clicks
Start generating HubSpot reports and dashboards right now and compile your results automatically and much more easily
What metrics can I analyze in the HubSpot report and dashboard?
Check out the available data on website traffic, lead capture, and email campaigns:
Landing page views
Total submissions
New contacts
CTA Views
Entrances
Exits
Landing pages bounce rate
Average time on landing pages
Emails sent
Emails delivered
Unique opens
Open rate
Clicks on emails
Click-through rates
Delivery rates
Number of hard bounces
Hard bounce rate
E-mails hard bounce rate
Unsubscriptions
Unsubscriptions rate
Delivery rate
Spam report rate
And much more!
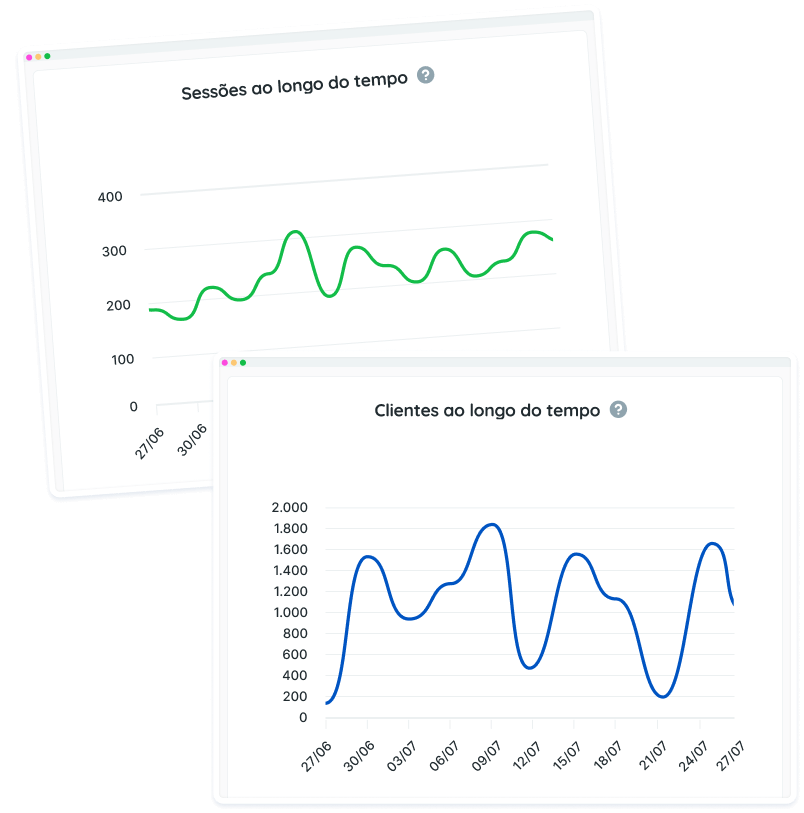
Along with all these metrics, the HubSpot Marketing report also brings comparative graphs that help understand information like:
- Customer acquisition over time;
- Contact by type: number of new and existing contacts who submitted forms;
- Sessions over time;
- Views by device.
An interesting detail is that, in addition to analyzing the graphs from the period selected for the report, you can now also view data grouped by weeks, months, or quarters, which helps track the evolution of indicators over time.
Tables
Lastly, we have tables for specific analyses of the results of your marketing actions. See which are available:
- Session origin, presenting key metrics according to the channels that generate website traffic
- Highlighted countries in website access
- UTM parameters, which allows for data analysis in UTM parameters in the URLs visitors use to access the website
- Featured blog posts
- Top pages: summarizing the performance of the HubSpot page during the period
- Form summaries
- Submissions by source, with views, submissions, and conversion rates by session origin when the form was submitted
- Featured emails, highlighting the main metrics of delivery, opening, and clicks.
In other words, through the combination of all these data, you can have a complete view of Inbound Marketing strategies on HubSpot, covering the top, middle, and bottom of the funnel.
HubSpot Reports: Present Data to Your Client in a More Practical Way
Used daily by more than 10,000 agencies, freelancers, traffic managers, and companies, Reportei allows you to generate unlimited, professional, and customized reports to facilitate communication of results with your clients.
Therefore, our HubSpot report has the most important information to demonstrate whether your strategy was successful or not, and what actions will be planned to achieve even better performance in the future.
To reflect the data in an objective and totally didactic way, you have some features that adapt perfectly to your reality and that of your client, as described below:


Your Benefits
- Add, remove, or rearrange metrics according to what is most relevant for the project and the decision-maker
- Add one or more analyses (with texts, videos, and photos) to each report topic if you want to interpret the data and explain some result in more detail
- Create a Timeline to expose, in a more visual way, what actions were taken at each stage of a particular campaign and what returns were achieved
- Download the report in PDF format
- Send the report to the client through a link
- Send the report via WhatsApp
In addition to HubSpot reports, you can also generate reports for Facebook, Meta Ads, Instagram, Google Analytics, Google Ads, YouTube, LinkedIn, LinkedIn Ads, Google Search Console, Google My Business, Mailchimp, and RD Station. Find the ideal plan for your projects and generate comprehensive, customized, and objective reports for your clients!