
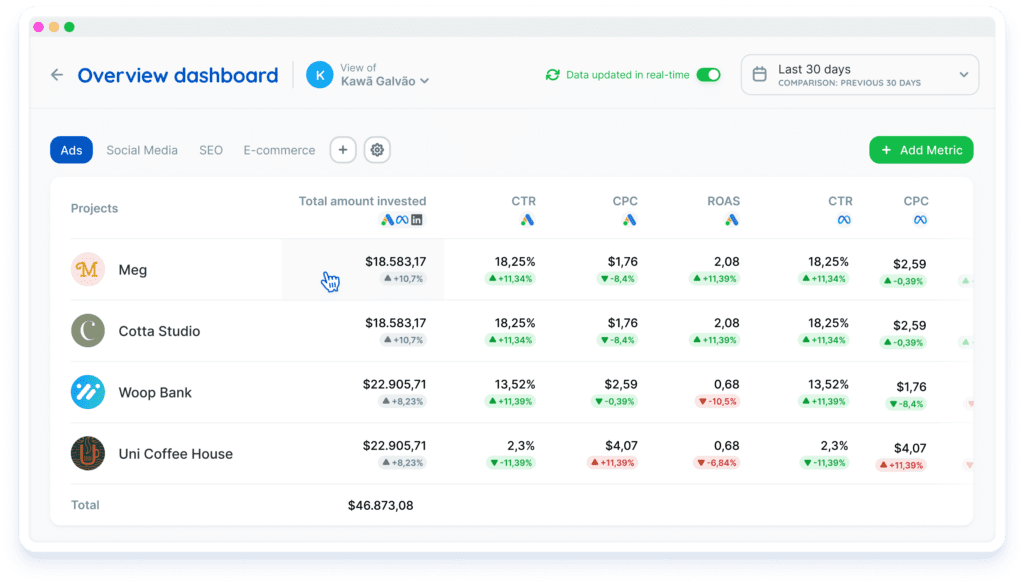
Overview gives you a consolidated view of several or all projects on one screen. It makes it easier to monitor key indicators and analyze project performance.
You can create custom pages in the dashboard for areas such as content, SEO, and paid media, or separate pages for individual clients.
This helps you organize and access relevant information in focused views. There is currently no limit to the number of pages you can create.
How to add pages
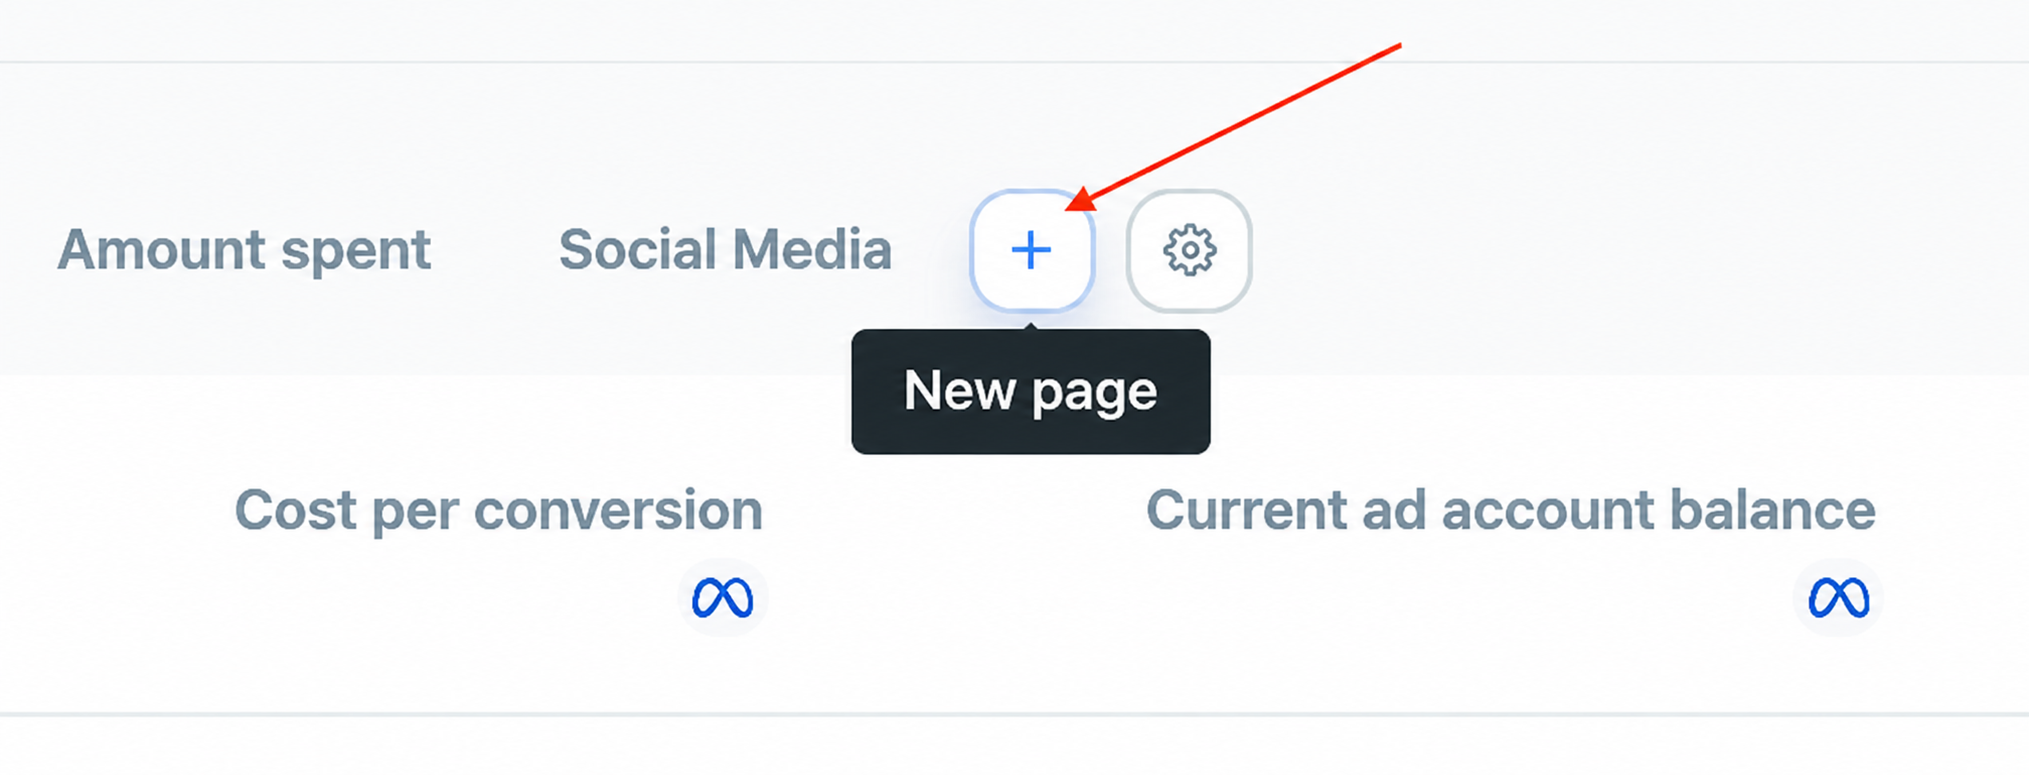
To add a page or view in Overview, click the “+” icon after the last existing page:
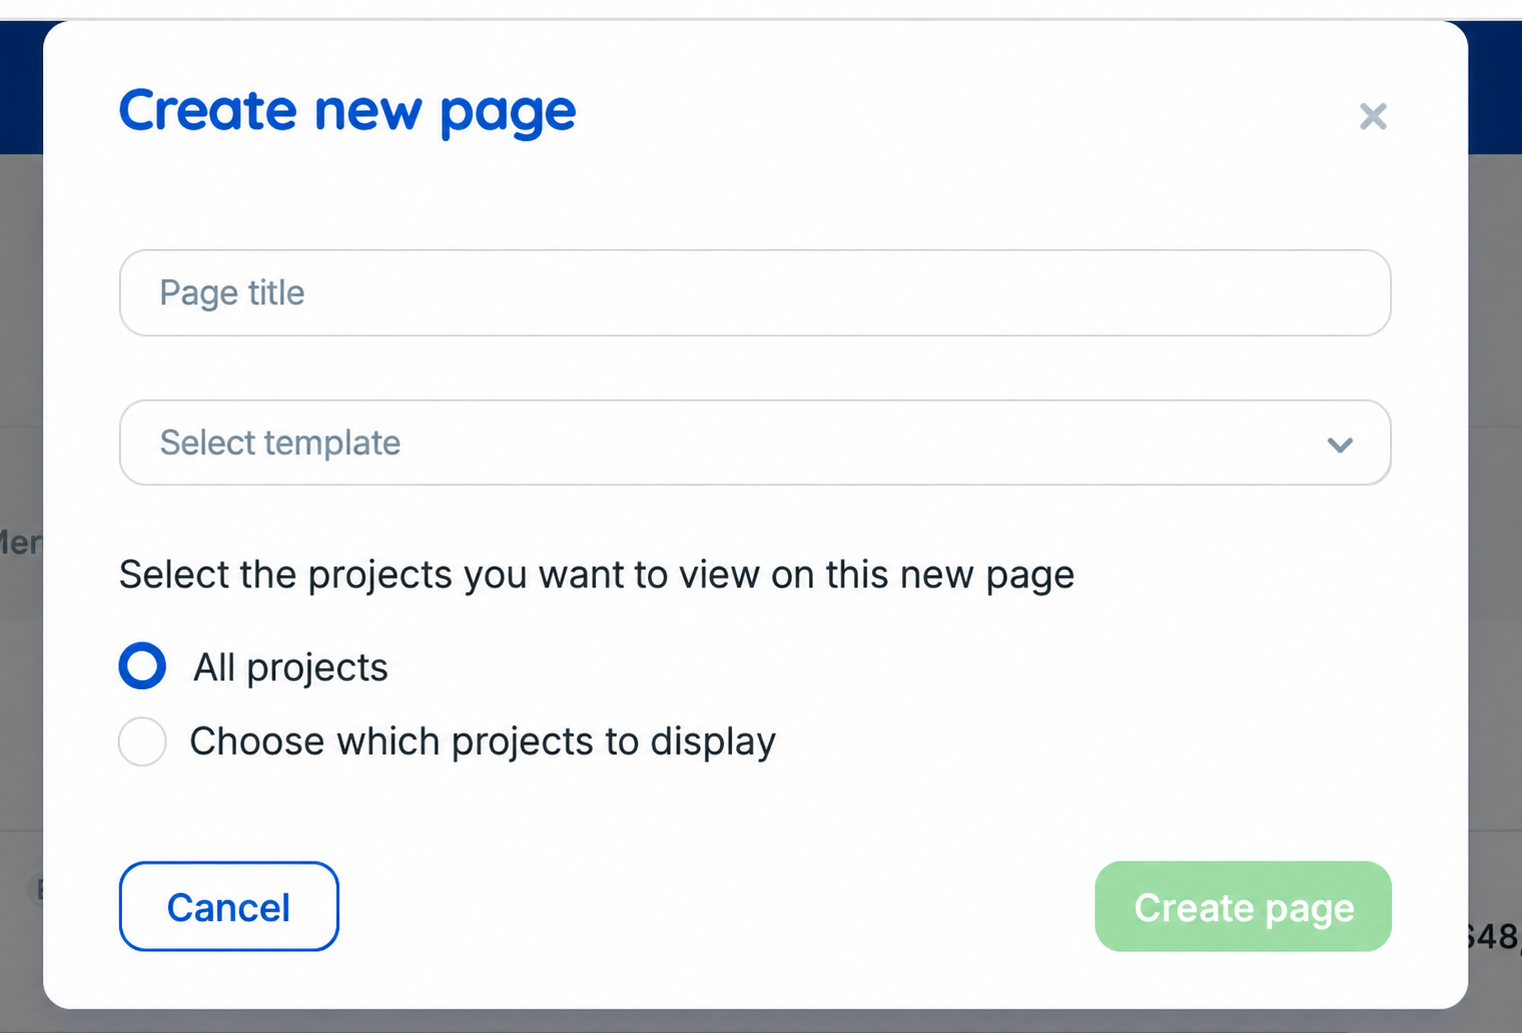
Name the new page, choose a base template or a blank page, and select the projects to include.
How to add metrics
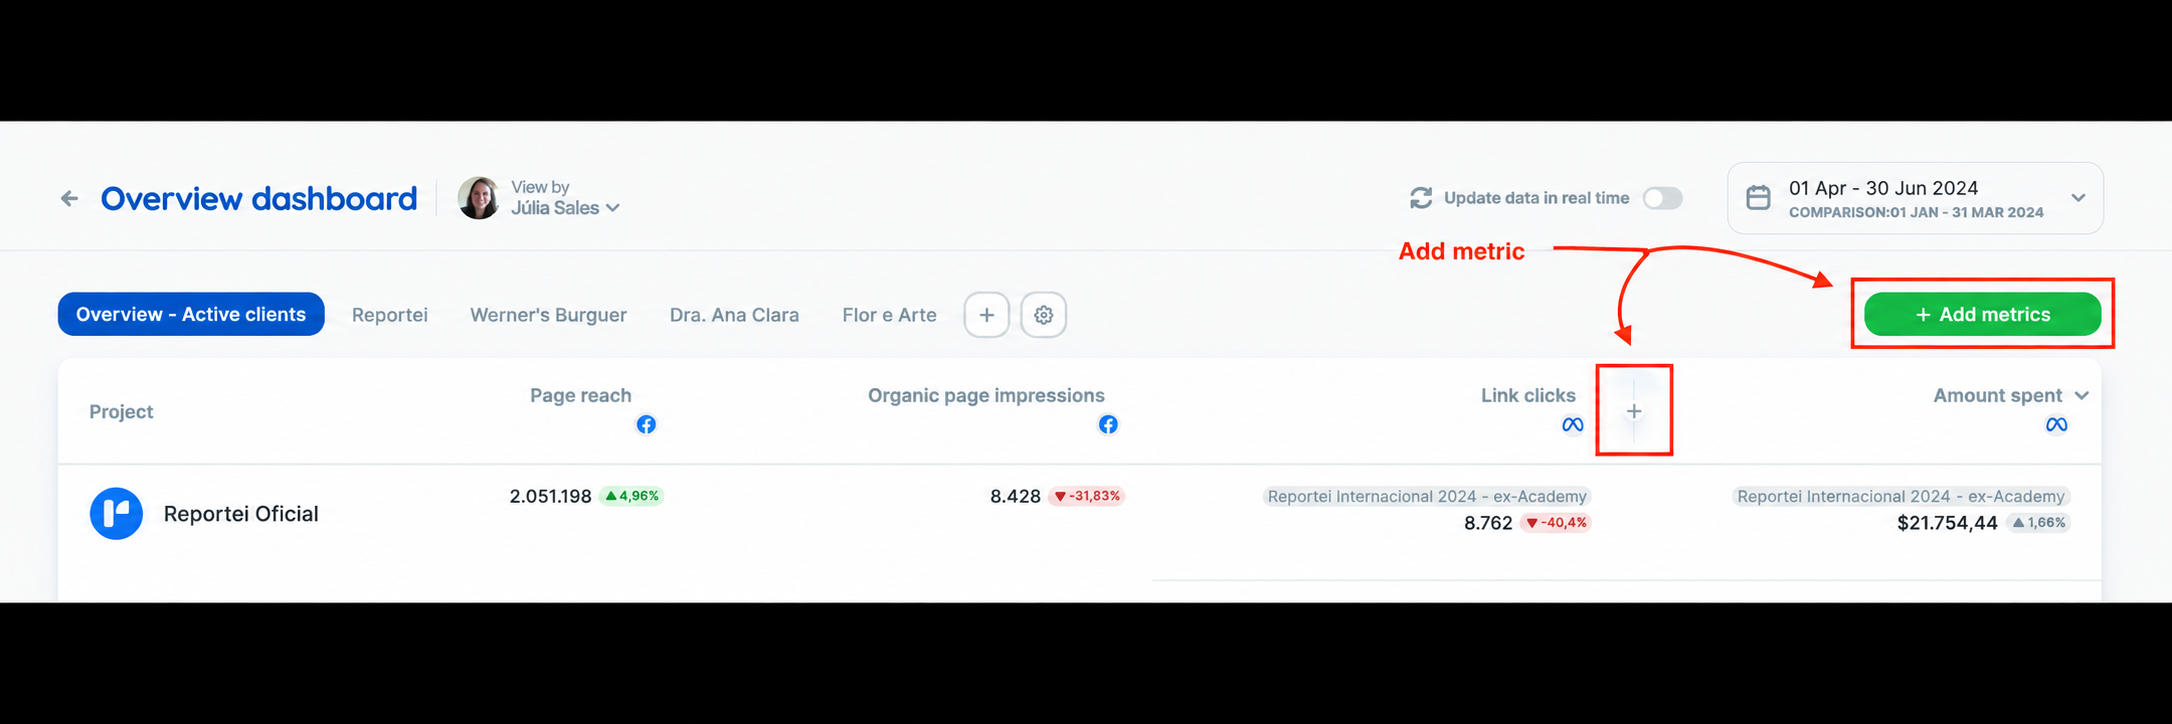
Choose the metrics you want to see across projects. You can add metrics from any Reportei integration.
Use either the “Add metric” button or the “+” button that appears when you hover between columns:
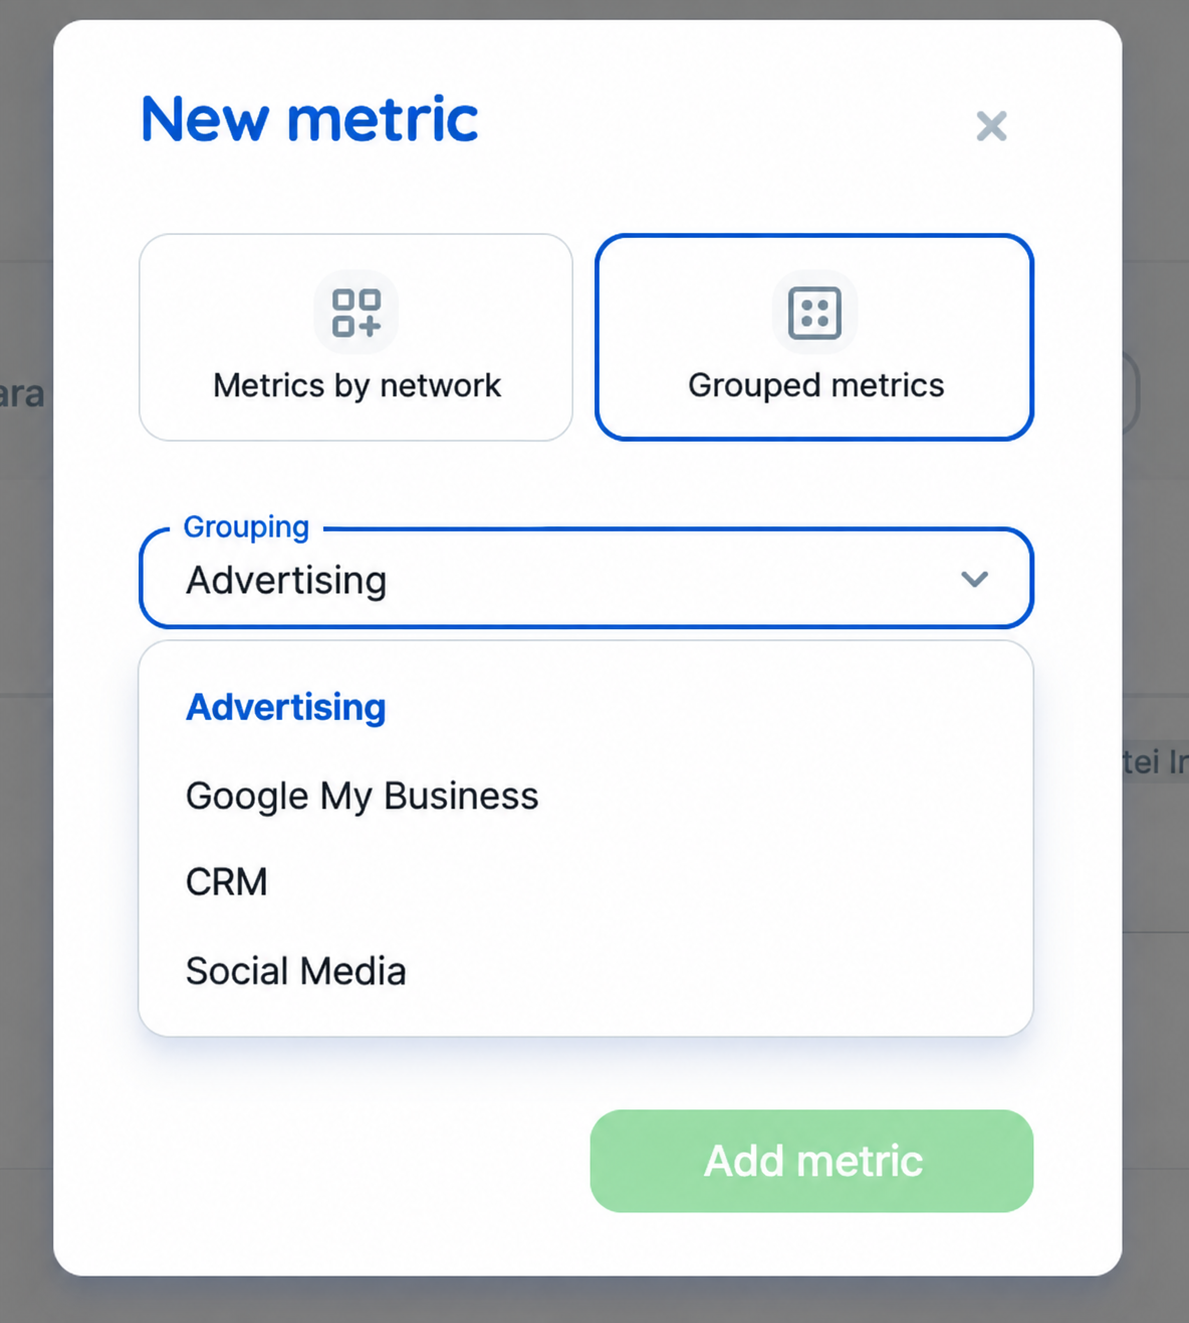
Adding grouped metrics
You can also add Reportei’s grouped metrics to display combined totals. For example, you can show total ad spend across all of a client’s advertising platforms. The four available metric groups are Advertising, Social Media, CRM, and Google My Business.
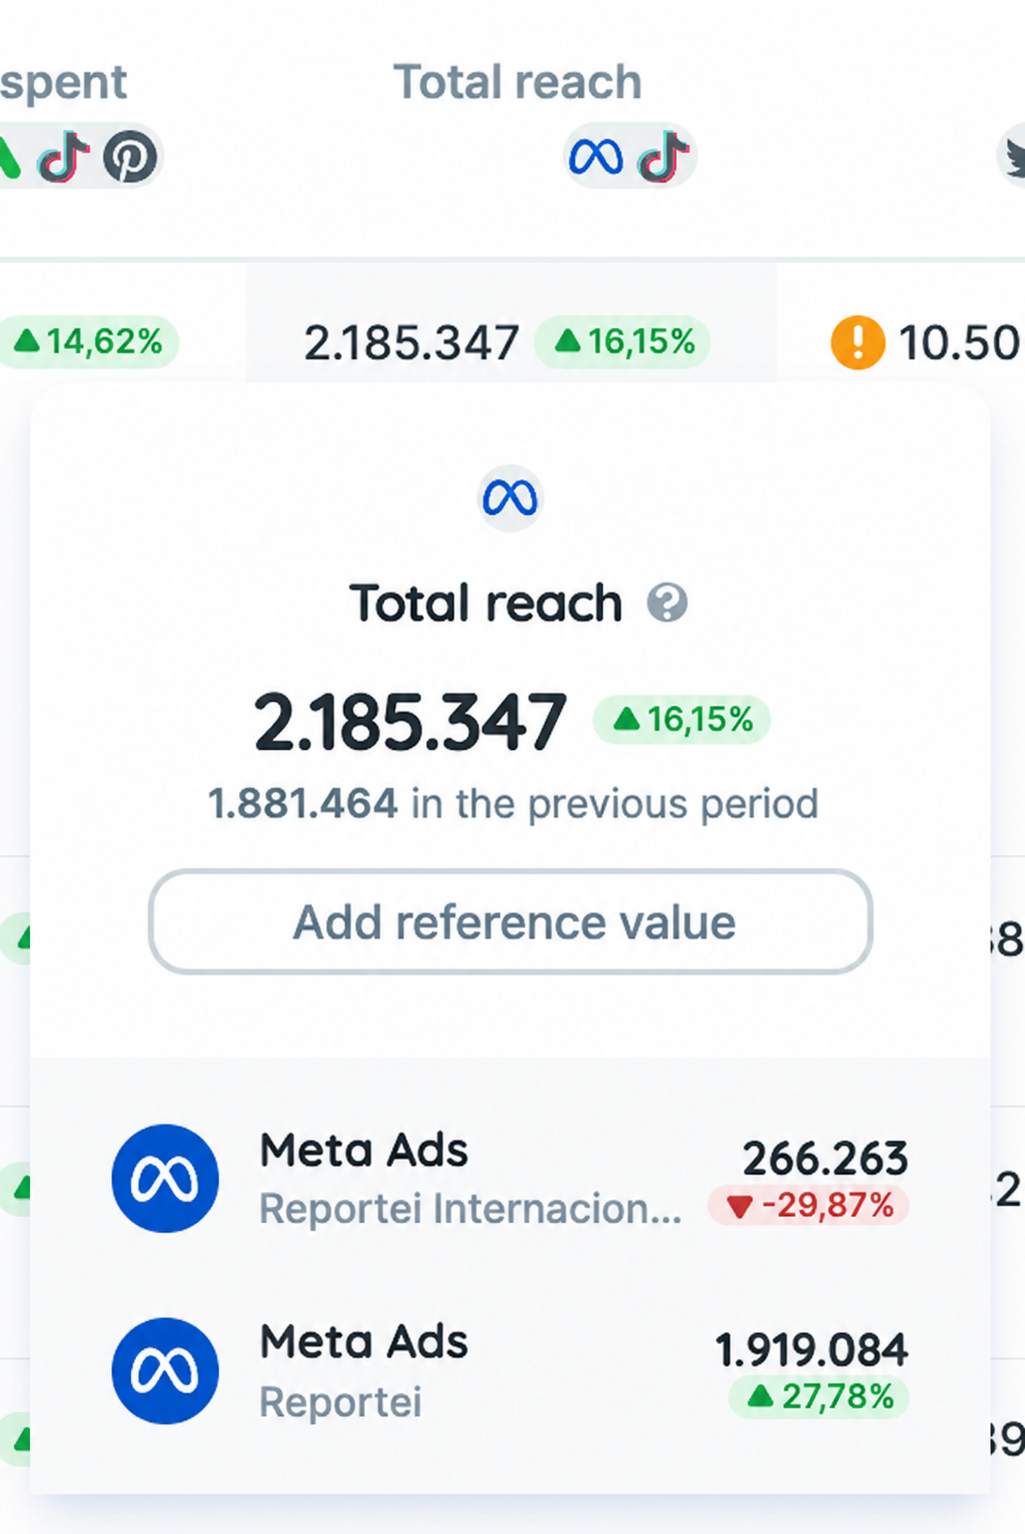
Click a metric value in the table to open a detail card. For grouped metrics, the card shows the value from each account included in the calculation. If an account has an error, an alert icon appears:
This video explains the option in more detail.
If you have questions, contact our Support team! =)