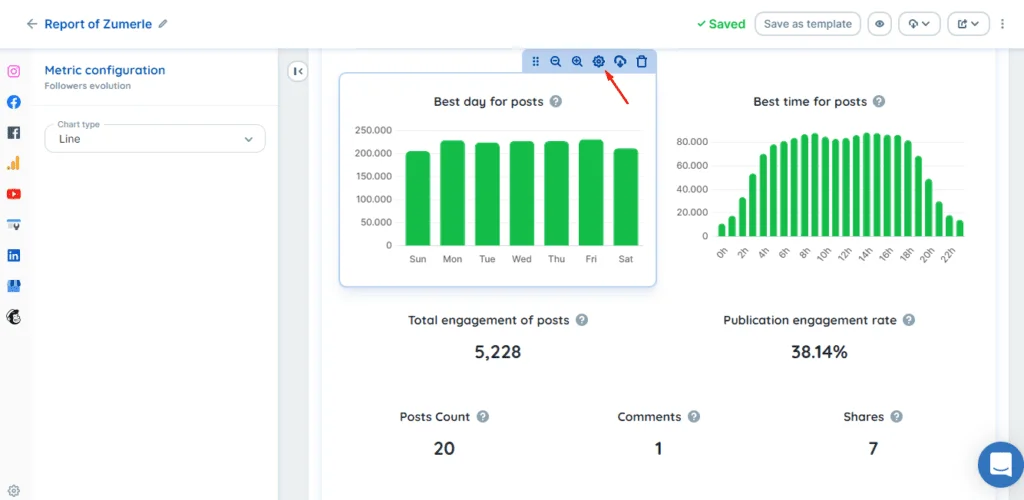
The new version of Reportei gives more possibilities for customizing the report and one of them is being able to configure a metric. When hovering your mouse over a metric, some options will appear and if you click to Edit, the left sidebar will expand with the possible options.
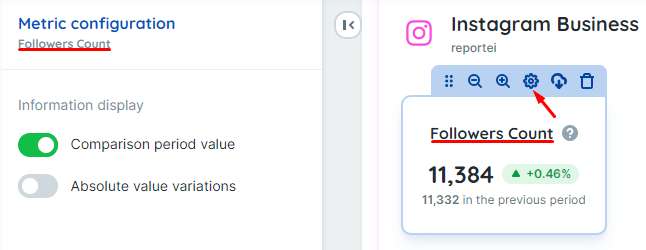
In the case of simple metrics, which are numbers (not graphs or tables), you can choose whether to show:
- the value of that same metric in the previous period or not;
- or if you want to show the variation (comparison percentage) with the absolute value;
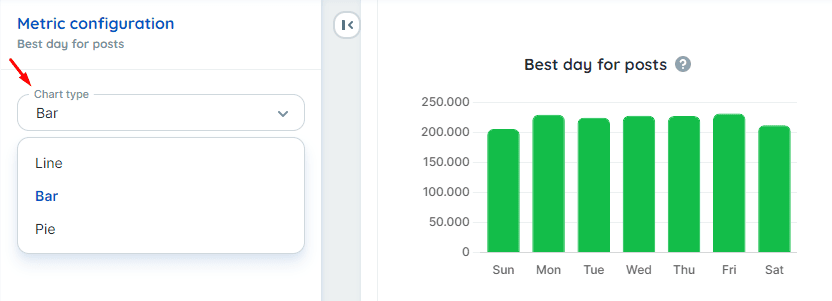
In graphs, you will have the option to select the type of graph. Attention: Reportei will show by default the most recommended type of chart for the information. So, depending on the information present in the chart, some type may not fit.
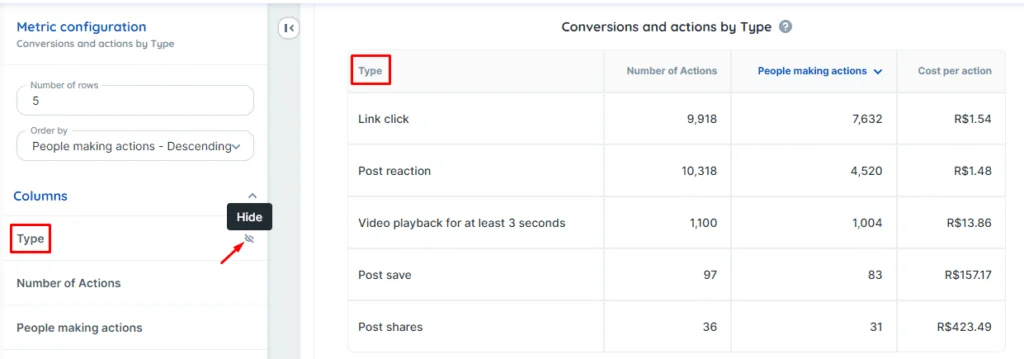
And, finally, the tables that have a much greater level of customization. You can select:
- The number of rows you want to display in the table
- How do you want to order the display of data in the table (metric and order – descending or ascending)
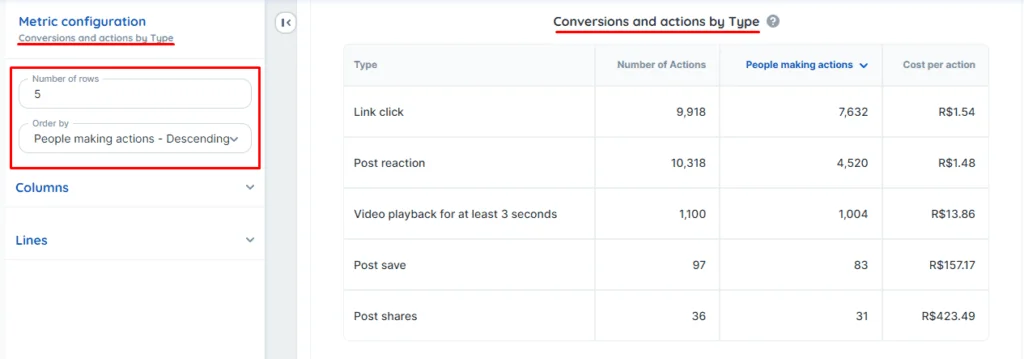
- And you can even click on columns or rows and hide some, if you wish:
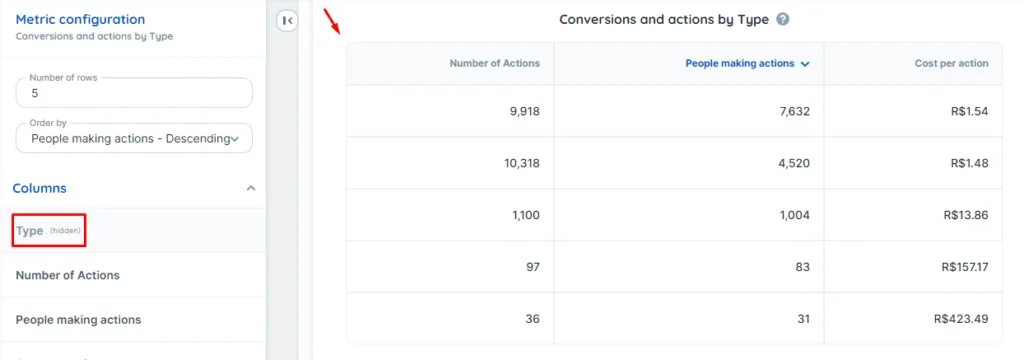
See how simple it is:
Any doubts, we are available on the support chat!
Our service is open from Monday to Friday, from 8:30 am to 6 pm (except holidays) 😉