Reports and Dashboards for Pinterest and Pinterest Ads
Optimize your TikTok Ads campaigns keeping all your key data on a single screen. Integrate your reports and dashboards with other digital marketing channels on Reportei!
Companies that trust Reportei


Full Pinterest reports and dashboards in only 3 seconds
Integrating your Pinterest and Pinterest Ads account with Reportei allows you to create reports and dashboards in seconds. Get access to your key metrics, performance graphs, and most importantly, individual campaign or ad results.
You can analyze your Pinterest metrics on a single screen and data from other channels integrated with Reportei. It’s much more practical for gaining insights and makes your planning and marketing investments more efficient.
Create reports and dashboards for Pinterest and Pinterest Ads in a few clicks
Analyze your Pinterest data right now and learn all about Reportei!
Check out the main metrics you’ll find in our Pinterest report and dashboard
Integrating your account with Reportei gives you access to the “Manage Integrations” tab. Then, you can create Pinterest reports and dashboards in seconds. You’ll find all the reach and engagement metrics you need there.
Here’s a list of metrics available to help you analyze your reach, views, spending, and more:
Number of Pins
Total Pins
Impressions
Engagement
Engagement rate
Total saved Pins
Total clicks on Pins
Click rate
Total boards
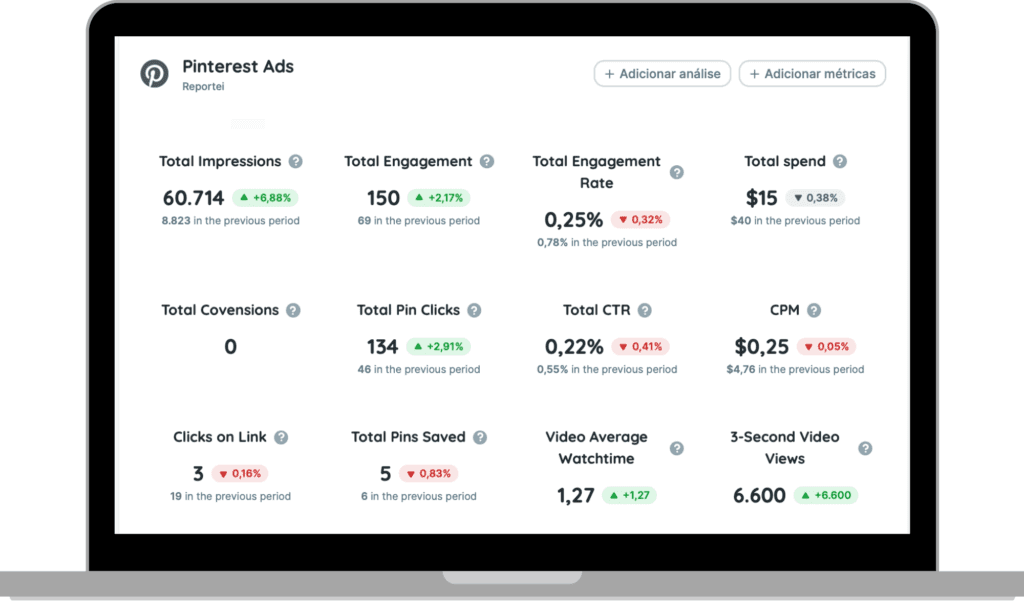
Ads
Total Pin clicks
Ads
Total number of saved Pins
Ads
Number of conversions
Ads
Total spend
Ads
Cost per thousand impressions (CPM)
Ads
Total Click Through Rate (CTR)
Ads
Total engagement on published Pins
Ads
Paid Engagement
Ads
Total impressions
Ads
Paid impressions
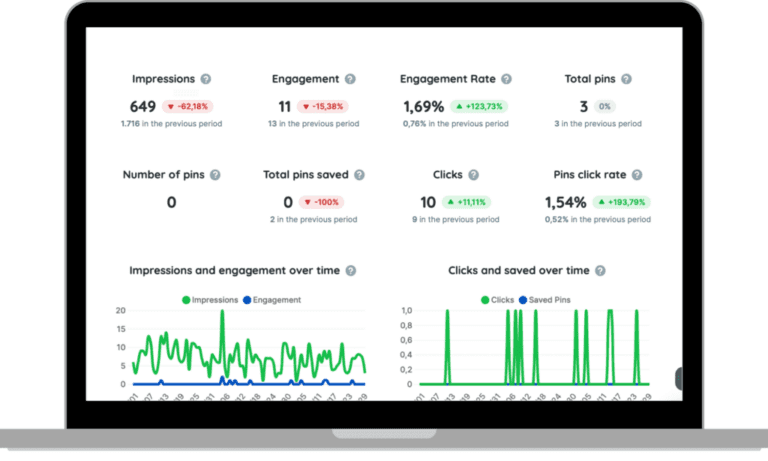
And even more!
You also get a graph showing clicks and saved Pins over comparison periods and the Featured Campaigns table with data on the engagement of your campaigns.
Are there any metrics we missed? Not a problem! You can insert them through our manual metrics feature to keep a complete record in one place.
Reports from Pinterest: Present data to your client in a more practical way
Present in the daily routine of more than 10,000 agencies, freelancers, traffic managers, and companies, Reportei allows you to generate unlimited, professional, and customized reports to facilitate communication of results with your clients.
That’s why our Pinterest report contains the most important information to demonstrate whether your strategy was successful and which actions will be planned to achieve even better performance in the future.
To reflect the data in an objective and completely didactic way, you have some resources that adapt perfectly to your reality and that of your client, as described below:


Your benefits
- Add, remove, or reorder metrics according to project and decision-maker relevance;
- Add one or more analyses (with texts, videos, and photos) to each section of the report, if you want to interpret the data and explain in more detail any obtained result;
- Create a Timeline to visually display which actions were taken at each stage of a specific campaign and what results were achieved;
- Download the report in PDF version;
- Send the report to the client through a link;
- Send the report through WhatsApp.
In addition to Pinterest reports, you can also generate reports for Instagram, Instagram, Facebook and Facebook Ads, Google Analytics, Google Ads, YouTube, LinkedIn and LinkedIn Ads, Google Search Console, Google My Business, Mailchimp, and RD Station. Find the perfect plan for your projects and generate comprehensive, customized, and objective reports for your clients!