We now have a new widget format available in reports and dashboards: the Funnel. It was developed in response to many requests we received through support suggestions and other research. The new widget is available for all plans and integrations.
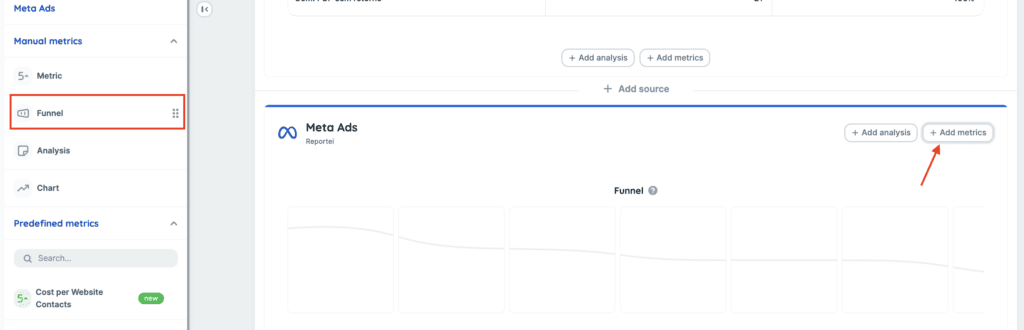
Like other manual widgets, it can be found listed in the left control bar. By clicking on ‘add metric’ or clicking on the icon of a network in the sidebar, you can view it. And to use this new option, just click and drag it to the report and once added, you can configure it.
When dragged into the report, a “skeleton” of the funil will appear like this:
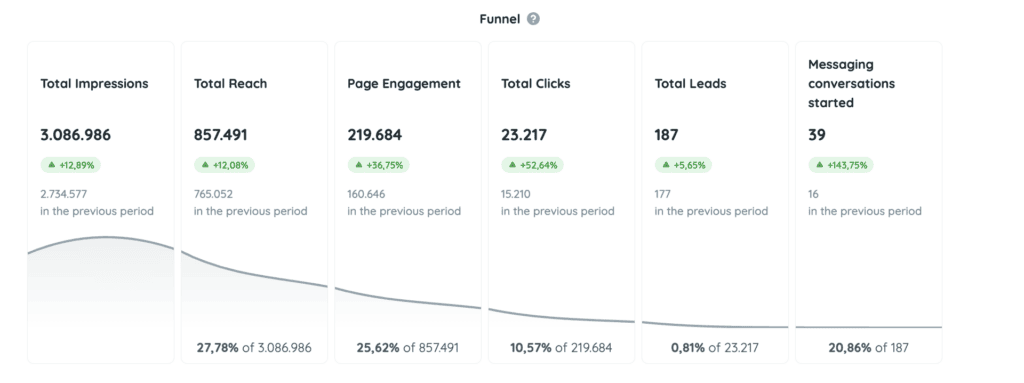
And once all steps are completed, and the funnel is generated, the widget will reload and bring the data in this way:
How does the creation flow of the Funnel work?
Definition of the Funnel
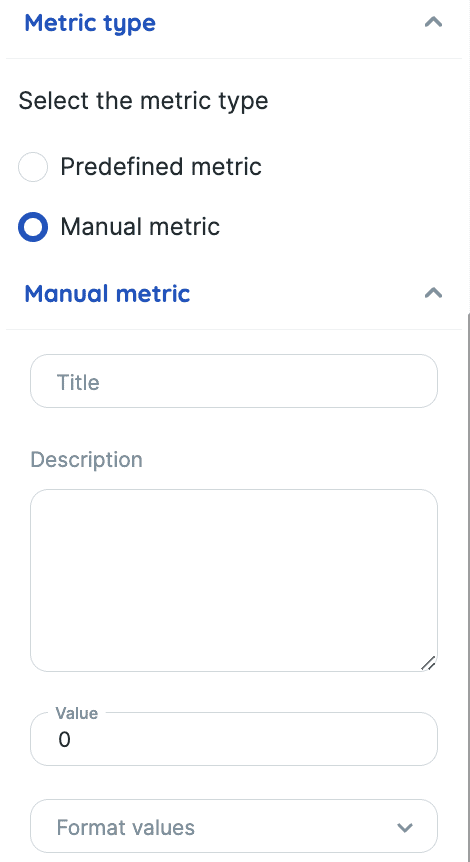
In this first part, the user will define the title and description of the widget, which will appear in the report/dashboard. By default, the title will already be filled in as “Funnel”:
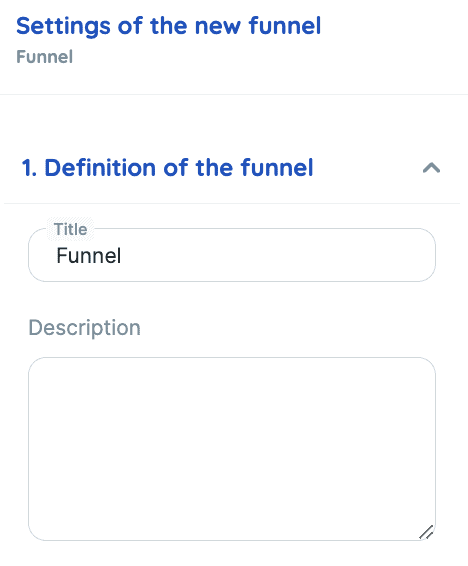
It is important to inform in the description what you are presenting in the pipeline, so it appears in the helper (?) when your client or anyone viewing the report can understand.
Steps
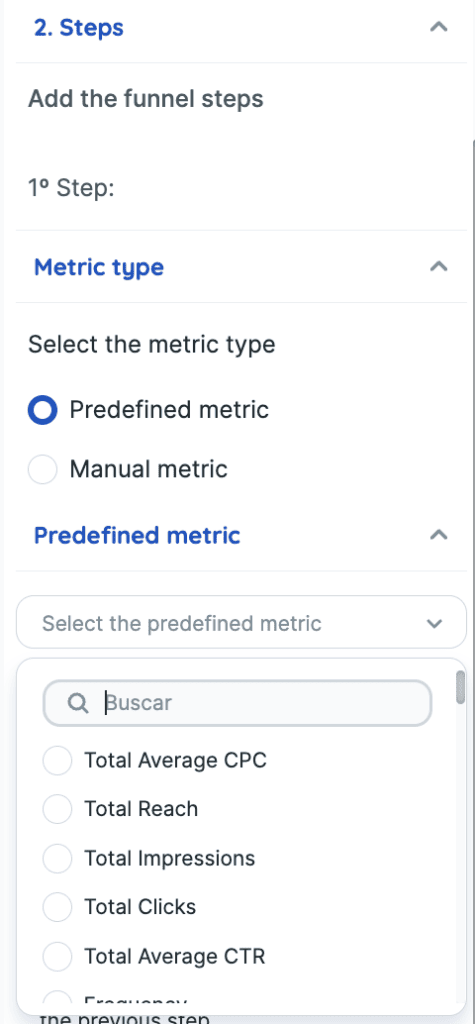
Next, you will define what the steps of the funil will be. Each stage is configured separately, and you find two possible types of metrics that can be used:
- Predefined Metric – these are the metrics we have available in our reports/dashboards. These metrics are captured automatically via API, so they update automatically when any change in the analysis period is made.
Selecting this option, a selector will appear with all the available metrics from the integration in question. You define which one you want to add.
- Manual Metric – these are metrics that you can manually insert: name of the metric, value, comparison value. Because of this, these metrics do not update with the change in the analysis period. The value will remain the same since we don’t have the historical data of that metric.
Selecting this option, a form will appear for the user to fill out all the data, from name, description to values.
And in both types of metrics, and in each of the step, you can also define the comparison period settings, and whether or not you want the stage to have the indicated conversion rate:
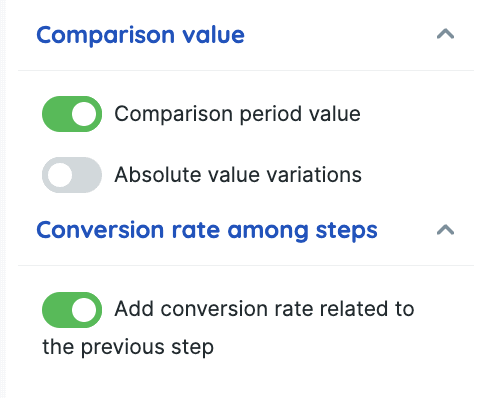
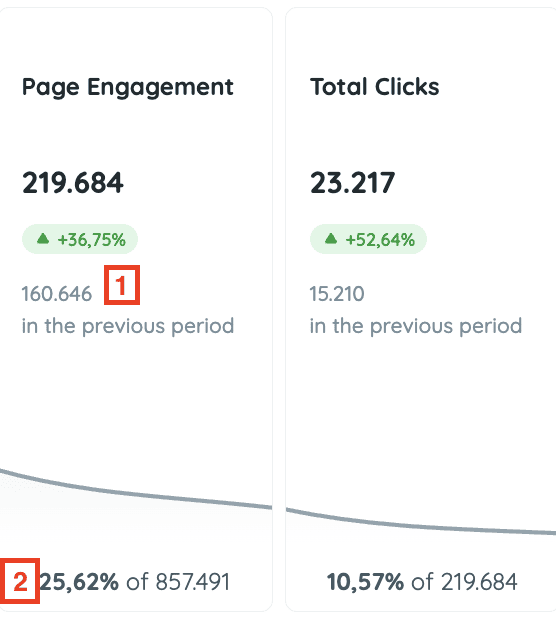
- The value and percentage of comparison will appear in the stage, in the same format as a number metric of the report: percentage + value of the comparison period;
Note: the value and comparison rate will only appear in the funil if the user generates a report with a comparison period. - The conversion rate between stages will appear at the end of the card;
Generation of the Funnel
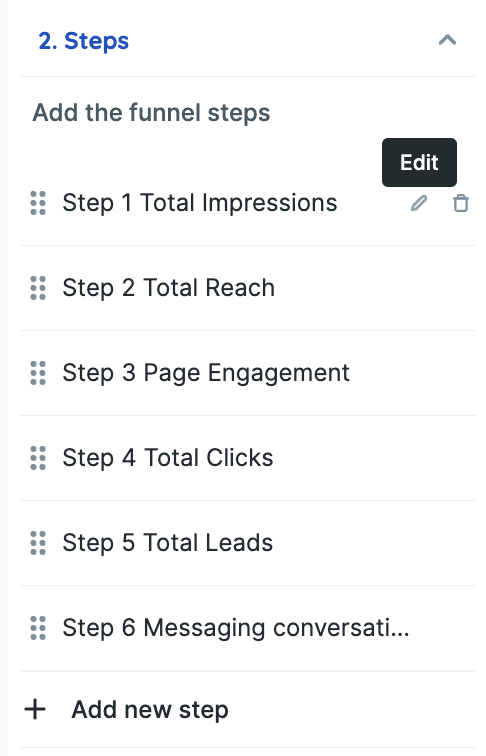
As the stages are added, they will be listed in the control bar, and you can click on “Create” from the moment that at least 2 stages have already been added.
After creating some stages, you can reorder, edit, or delete any of them. And these same possibilities are available after creating the Funnel:
Currently, there is no limitation on the number of stages of the funil. However, when more stages are added than fit in the width of the report, there will be a scroll bar:
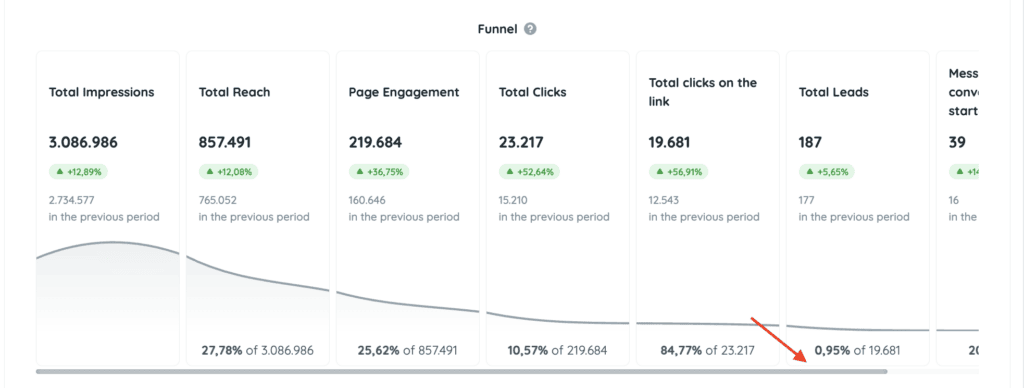
Attention: The scrolling of a funnel can affect its view in PDF. Therefore, we suggest that in cases of funnels with many added stages, it be shared through the link for a better experience.
If you have any questions about configuring the funnel, please contact our support team via chat! =D