You can change the analysis period of the charts to check periods prior to the report. For example: generate a monthly report, but view a chart for an entire year.
This possibility is available for ALL Reportei charts, even for networks that don’t yet have customization. And it also works for manual charts 😀
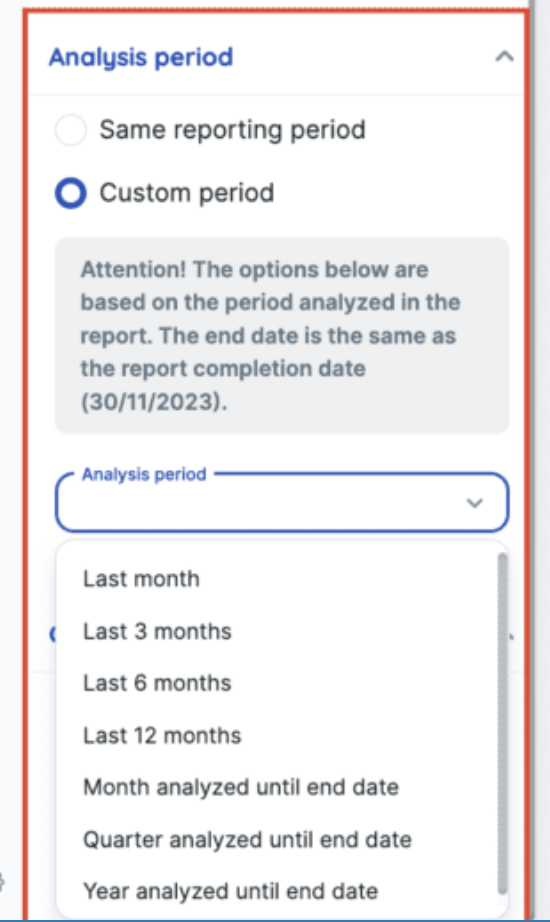
👉 Where is the period change made in the chart? When you click on the “edit” option of any predefined chart in the report, a new “option” will appear in the control bar with the information “Analysis Period”. By default, it will be selected for the same period as the report. When you select a custom period, the custom options will appear:
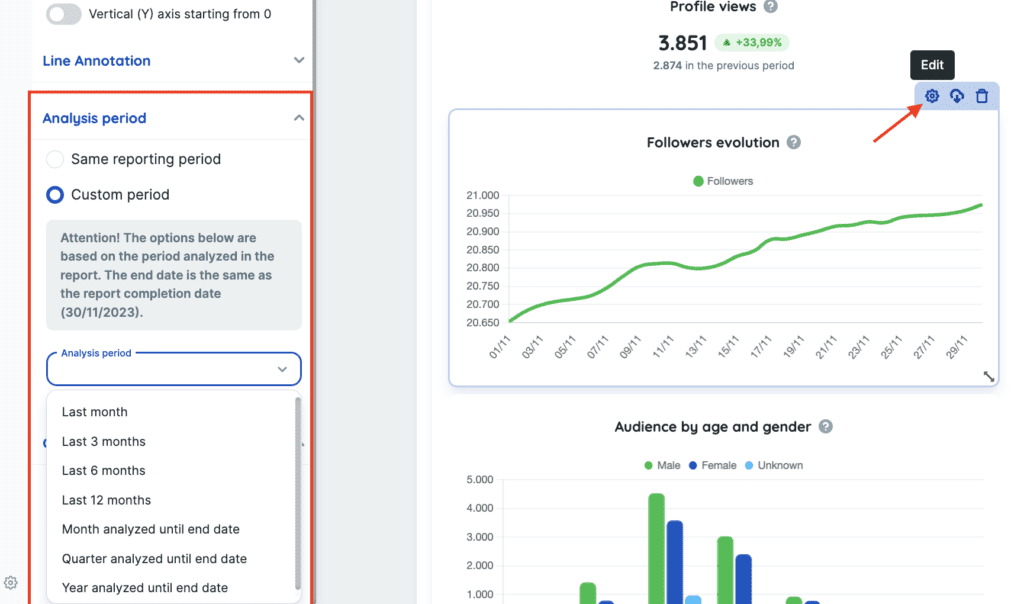
Currently, the available period options are those that appear for selection in the selector (as in the image above).
⚠️ All period options offered are based on the analysis period of the report and not the current period. So only the options that have the information “up to the final date” will consider showing up to the final date of the report’s analysis period.
Example: assuming that today (25/04/23) I generate a report for February (01/02/23 – 28/02/23). In the custom period option “previous 3 months”, the chart will show from 01/11/22 to 31/01/23 while the option “Quarter analyzed up to the final date” will show from 01/01/23 to 28/02/23.
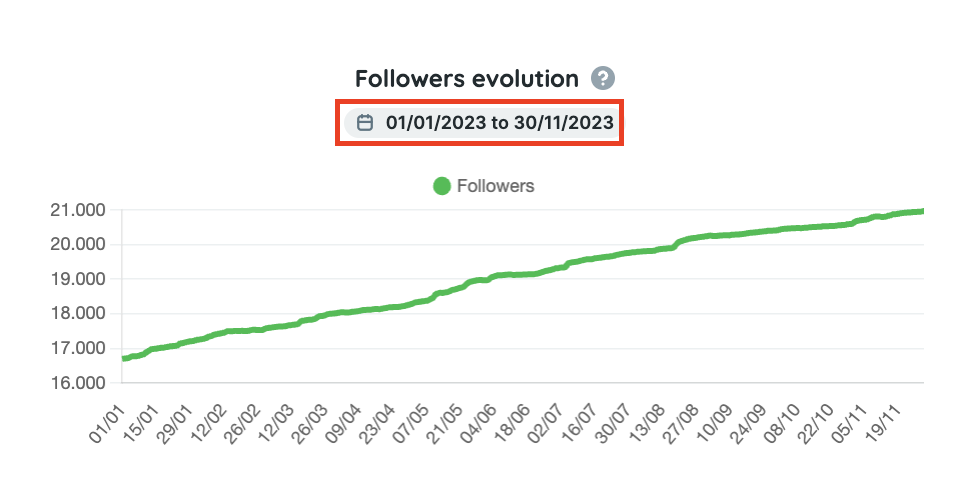
🤔 And how will this custom period appear in the report? In all charts where the date is different from the report, a “tag” will be added below the title, with the chart’s date added:
How will it work for manual charts?
The same “Analysis Period” option will appear for you to configure, and it will work in the same way as any of the predefined charts:
Does it work within a campaign container?
Yes, it works! 🤩
⚠️ But be careful! Campaigns usually do not have data for the entire existence period of the account. So depending on the selected period, there may not be data.
Example: the campaign below was activated on 23/02/23. When selecting the period “last 3 months”, no data is returned. And therefore, the chart returns with this warning: “No data was found for the period analyzed”
And the same behavior can occur for new integrations, or for networks where we don’t have data for the entire retroactive period (such as the “Follower Growth” chart for Instagram).
Does it work in templates?
Yes! The custom period option is saved in the template chart. When generating a report with another period, the charts return respecting the custom period of the chart, but based on the analysis date defined in the new report. That is, they do not return exactly the same date as the template chart, as it will vary according to the analysis period of the report.
👉 This same behavior applies to date changes within the report or dashboard.
Example:
- I generate a February report;
- I add a manual chart with the custom period “Year analyzed up to the final date” (01/01/23 to 28/02/23);
- I save a template of this report;
- I generate a new report for the last week 17/04/2023 to 23/04/2023;
- The chart returns with the updated date (01/01/23 to 23/04/23), according to the new selected period.
So, did you like this new option?
If you have any questions, please contact our support team!