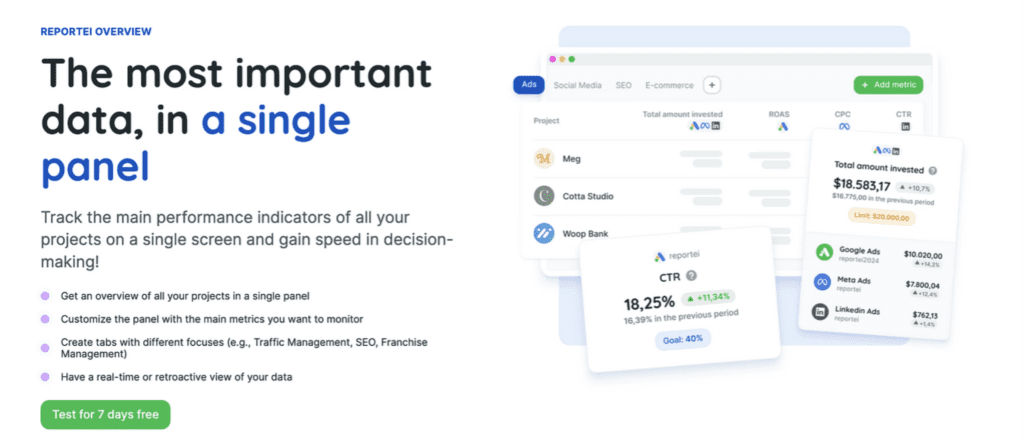
The Overview is a general view panel that offers a global view of all projects linked to your Reportei account on a single screen. It allows you to monitor key indicators on a macro level, making it easier to evaluate the performance of projects and team members without needing to access each project individually.
This feature is aimed at internal and managerial use, providing an efficient way to monitor and manage projects.
Panel Features
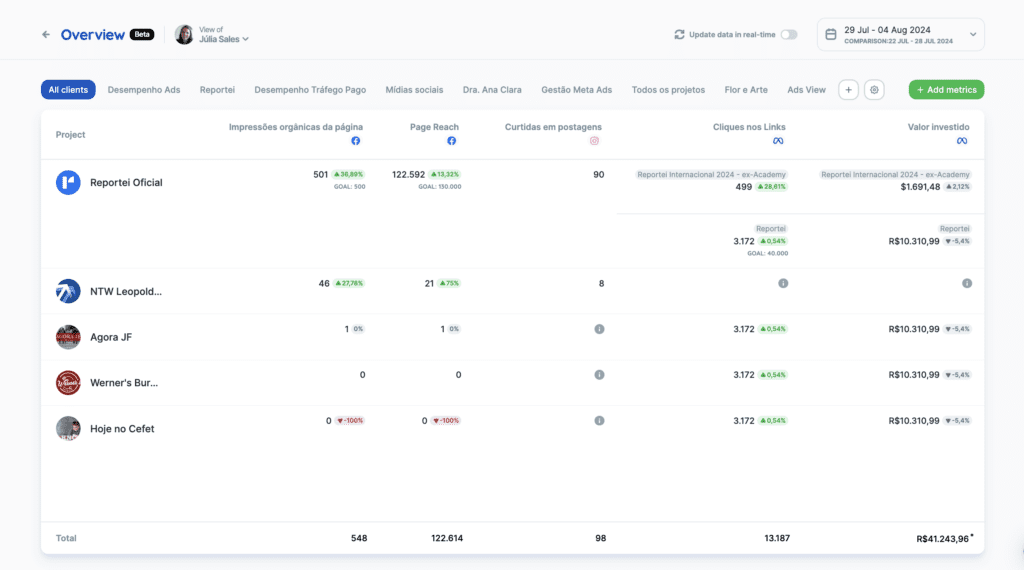
The Overview allows for a general visualization, meaning you can see multiple (or all) projects on a single screen. This facilitates the monitoring and analysis of the most important indicators, providing a comprehensive view of project performance.
Since it encompasses all projects, the panel is unique for each company (account) in Reportei. Thus, even if there are multiple team members, everyone will have access to the same panel.
Here we will explain some features:
Multiple Views
It is possible to create custom pages within the panel according to the different areas of the company, such as content, SEO, and traffic, or even by client.
This helps organize and access relevant information in a segmented manner. Currently, there is no limit to the number of pages that can be created.
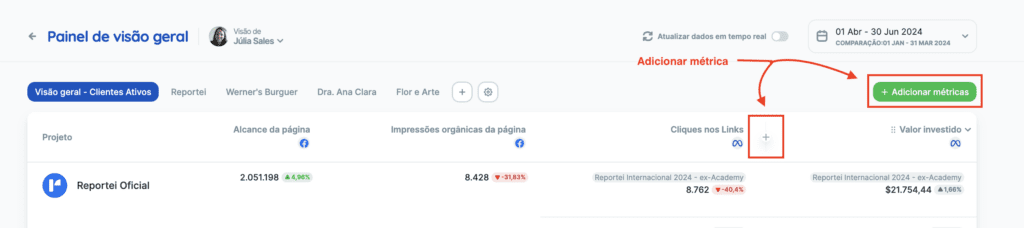
Metric Selection
You can select which metrics will be viewed on a macro level. It will be possible to add metrics from any of the available integrations in Reportei.
There are two options for adding metrics, using the “Add metric” button or the “+” button that appears when hovering between columns.
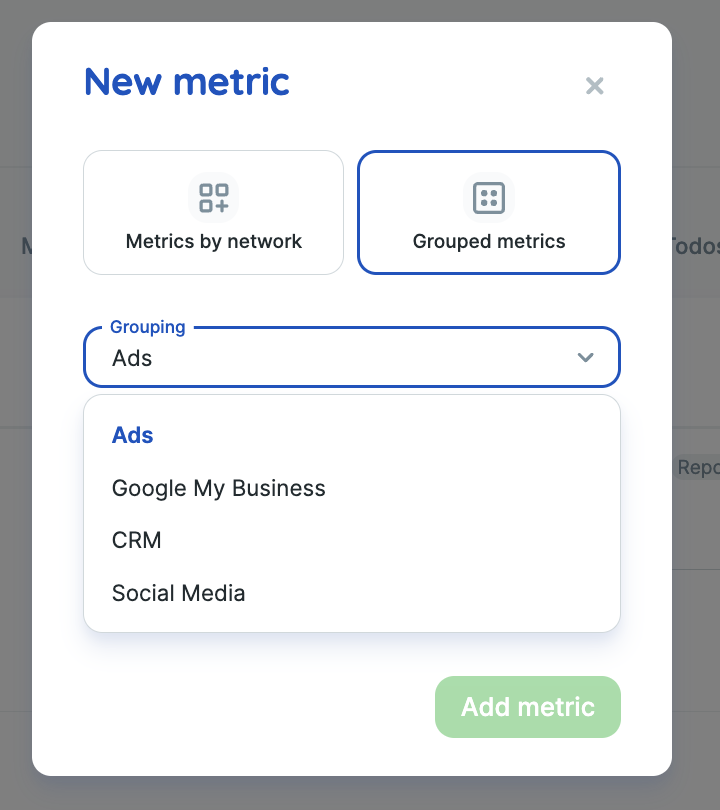
Grouped Metrics Addition
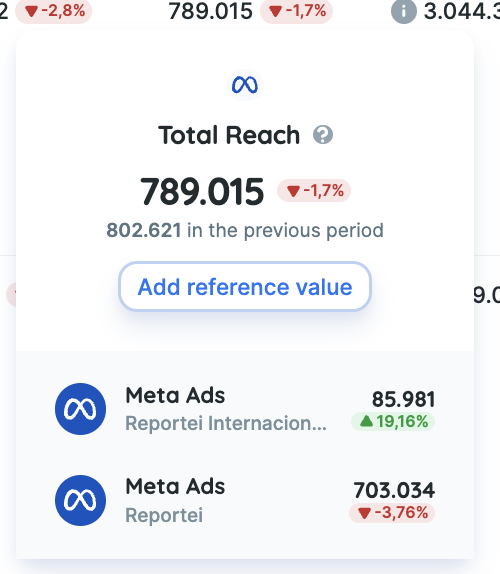
It is also possible to include grouped metrics already available in Reportei, displaying the total value of some data. For example, the total amount invested in ads, summing the data from all the client’s ad networks. Currently, we have four grouped metrics available: Ads, Social Media, CRM, and Google My Business.
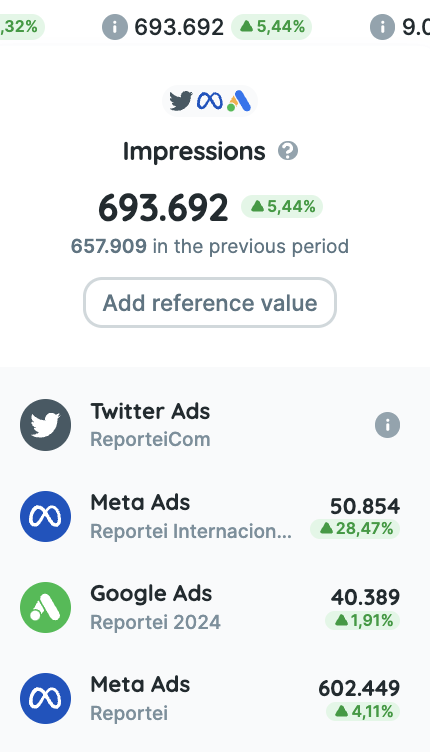
By clicking on any of the metric values in the table, a detail card will open. For grouped metrics, the values for each account included in the calculation will appear. If there is an account with an error, an alert icon will indicate this.
Real-time Data
With this feature activated, the panel will automatically update, bringing real-time data. Currently, we check every 30 seconds for updates. On average, data updates every 1-2 minutes.
For real-time data to update, the analysis period must be selected in one of the 3 periods that include the current day:
- Last 7 days
- Last 15 days
- Last 30 days
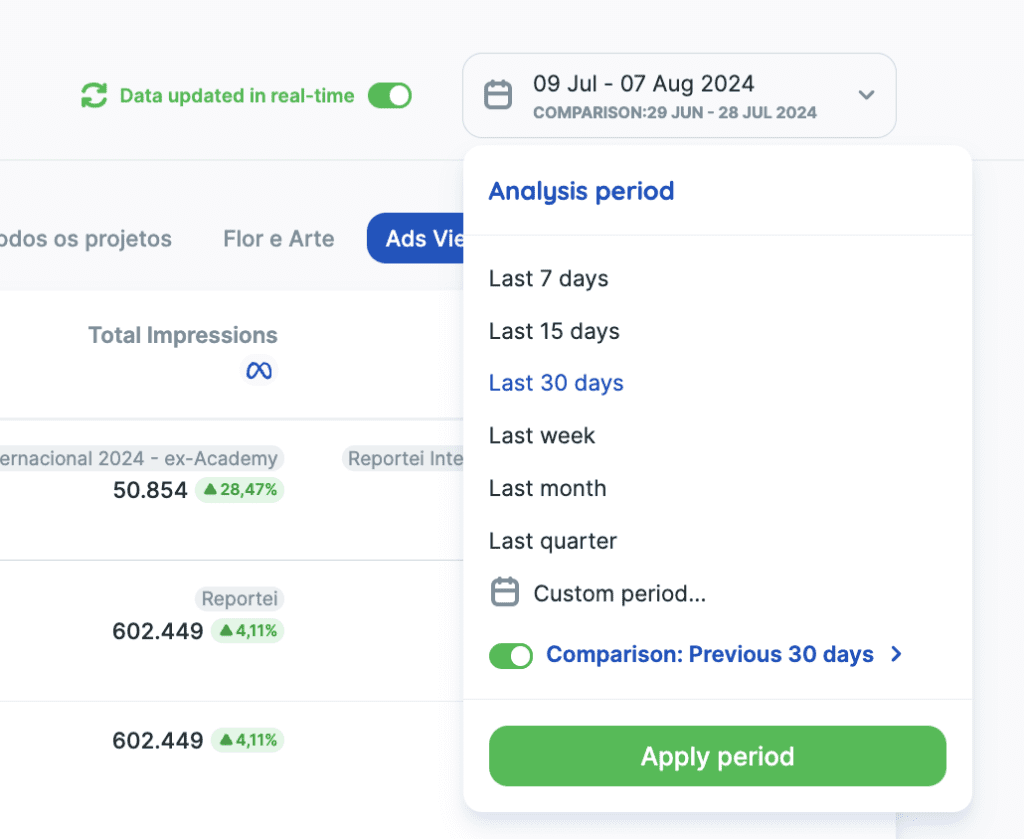
If you select another option or a custom period, a modal will confirm that by making the change, real-time data will be deactivated.
This provides an up-to-date and accurate view of project performance. But it will also be possible to select and view data from past periods.
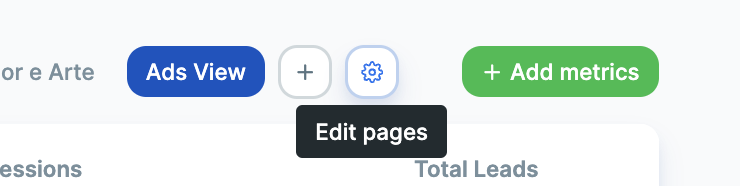
Panel Customization
It will be possible to create new pages, name each one, and select which metrics will be part of the view. You can select one of our templates or a blank page.
Additionally, you can set the order of tabs and metrics, ensuring that the most relevant data appears first.
Simply click on edit pages to see the possibilities.
Total Line
The “Total Line” offers a quick and consolidated view of the totals in each column of the table, facilitating the analysis of large volumes of data and allowing immediate comparisons between different indicators. This supports decision-making by providing a clear understanding of the aggregated impact of the metrics, saving time, and minimizing errors by reducing the need for manual calculations.
Note: rate metrics do not return data in the total line, as it does not make sense to return the sum of these values.
Reference Values
This feature allows you to set limits or goals for each indicator. This way, you can monitor performance against these parameters and quickly identify if objectives are being met.
To add a reference value, click on one of the table values, and in the detail card, click the add button. Then just define if it is a goal or limit and fill in the desired value.
We know this option can still evolve! In the future, it might be tied to control metrics, for example. But for now, we will run this simpler test to validate the usefulness of this feature. If you want to change or delete the value, click on the edit option within the detail card.
Performance by Team Member
Managers can view the control panel as if they were a specific team member, allowing for a quick evaluation of individual performance. This feature is only available to the owner or admin of the Reportei account, while team members do not have access to this option.
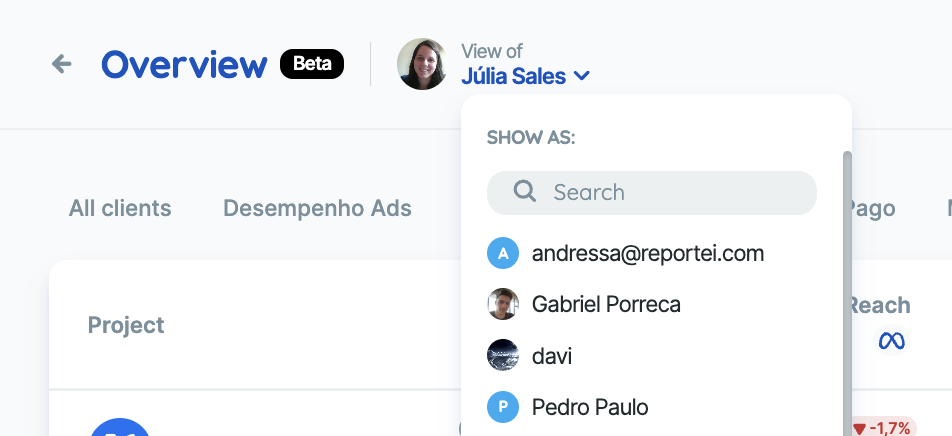
With this function, managers can quickly identify which team members need more attention, especially if each has a specific client portfolio. By selecting a specific member’s view, only the projects that this member has access to will be displayed, facilitating monitoring and management.
To make the most of this feature, it is necessary to use Reportei’s Teams system, inviting each member and granting them access permissions to the projects they manage in your company/account.
Which plan is Overview available on?
- Overview is an exclusive feature of the Premium Plan.
- If you have another plan, you will be entitled to a 7-day free trial. The trial is activated within Reportei itself, by clicking to test as shown in the image below:
If you have any questions, contact our Support team via chat!