Use Reportei’s dashboards for strategic digital marketing analysis and more efficient decision-making
Reportei’s digital marketing dashboard is a tool to help analysts work more efficiently and dynamically. It optimizes data capture and project productivity.
The main difference between our dashboards and reports is that dashboards let you go back and forth between analysis and comparison periods without creating a new document for every campaign or action.
If you still haven’t used our dashboards, here’s an article with tips on their features, benefits, how to use them, and how they differ from static reports. Keep reading!
Creating dashboards in Reportei
Creating dashboards in Reportei is simple. You can create one quickly and automatically with all your project metrics, analyze data from all your channels, or select the most relevant.
Once you access a client’s account, you’ll find a tab with your project dashboards. Click New dashboard and follow the steps below:
- Choose a template for your report. You can select a standard template or one of your previously saved custom models;
- Next, choose analysis and comparison periods for your dashboards (you can make changes at any time);
- Finally, select the networks you’d like to analyze. For Ads accounts, you can import data from all your channels at once or by a specific campaign.
Then, tap to continue. You’ll only need to wait a few seconds to access your dashboard.
What can you do with Reportei dashboards?
Like Reportei reports, dashboards are customizable and can be used for different purposes:
- Add analysis in text, video, or image anywhere on the dashboard. For example, you can insert an analysis into the introduction as a guide for your customer, giving him insight into how the dashboard works.
- Choose a custom layout with your most relevant metrics and channels. You can save templates and use them later for the same project or a different one.
- Integrating your Ads accounts with Reportei allows you to perform a full account analysis or analyze specific campaigns with in-depth data on each.
- Allow your customers to interact with data, change dates, and closely monitor results from different periods.
How to use digital marketing dashboards to analyze your performance
Reportei’s dashboards help you analyze your project performance and give you quite a few benefits. Here are four of them.
All your relevant data in one place
One of the main benefits of any dashboard is that you can keep a record of all your information in one place, and our dashboards are no different.
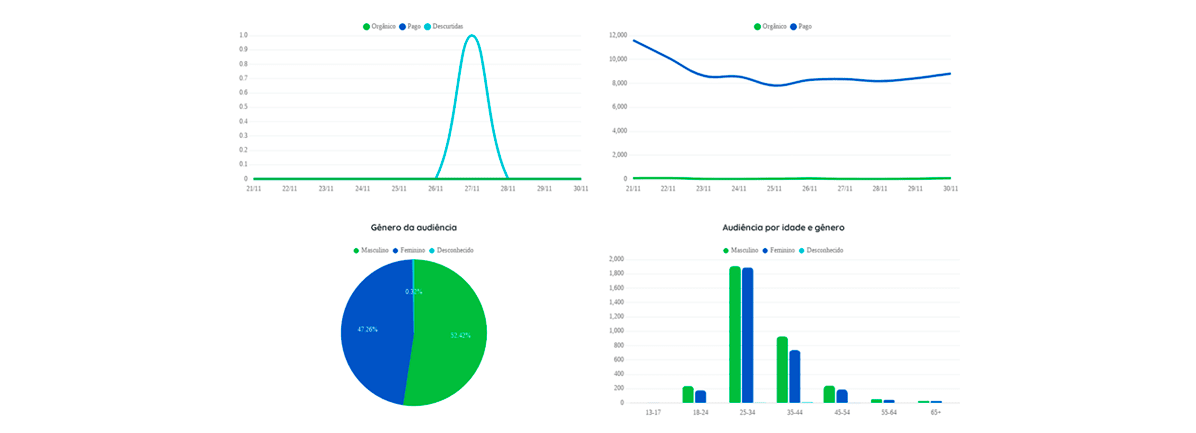
As we mentioned, our metrics dashboards import data from your integrated channels. You can also customize dashboards and direct your customer’s attention to what really matters.
Faster result updates
Since you can change analysis and comparison dates, you can track changes between different periods quickly. And that’s not all! You can also monitor metrics from several channels in real-time.
Faster decision-making
With easy access to project results, you can extract insights more efficiently. Dashboards identify problems or necessary optimizations quickly to help you make more precise decisions.
Sharing data with your team and clients
One major benefit is how practical it is to share data with clients and team members.
Once you share the link, members or decision-makers can view and interact with the data in the dashboard, selecting different periods and comparison dates for an in-depth understanding of results.
Dashboards vs Reports: How they differ
You might be wondering how our reports differ from dashboards, right?
Actually, the two complement each other, giving you a more accurate and complete analysis of results relevant to decision-makers. But while reports are static, with data from a specific period, dashboards are more dynamic and offer insights more quickly.
So, using them together is the best way to optimize your data analysis and communication with clients.