Do you keep your data in Excel dashboards? Here’s why Reportei’s are more practical and efficient
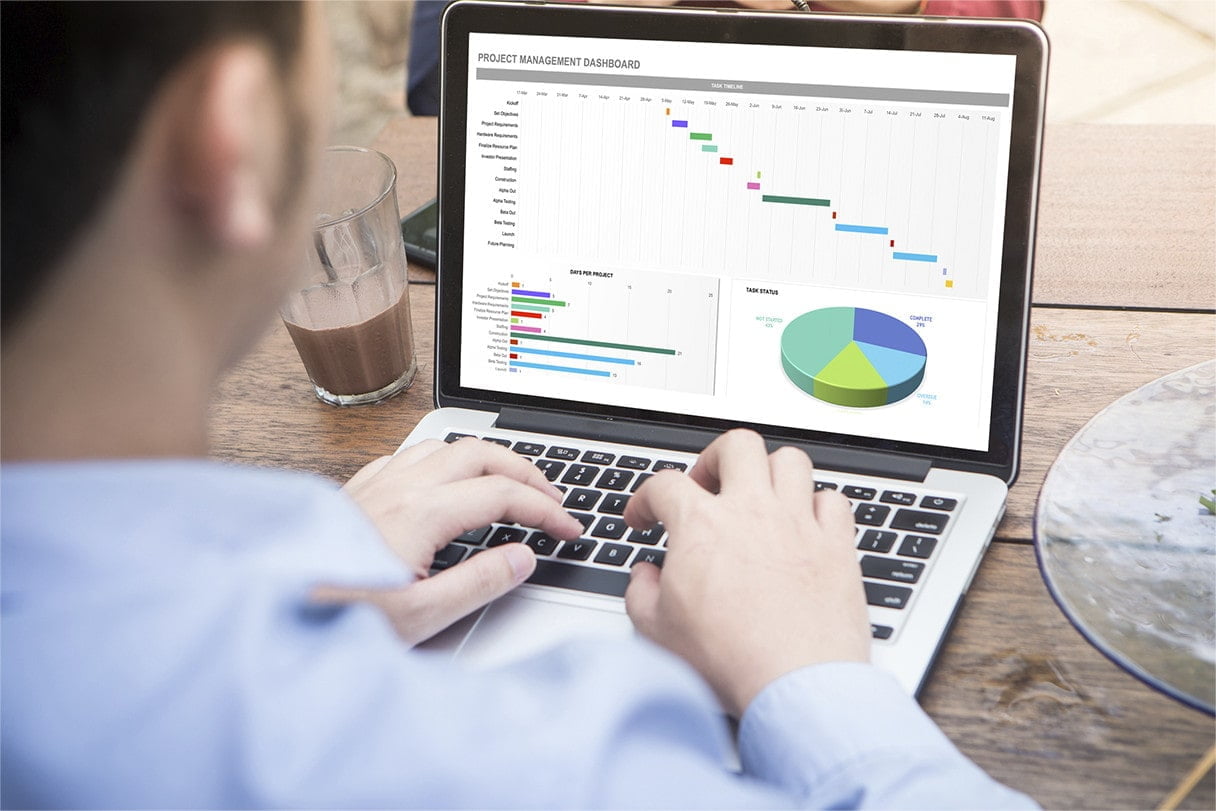
Although Excel dashboards are widely used in agencies and companies, they’re not always the most practical for monitoring digital marketing data.
Though free and accessible, spreadsheets are not the easiest to create and update. Besides, the data display is not the most intuitive for teams and clients.
This article covers the differences between Excel dashboards and automated Reportei dashboards, which contain metrics, graphs, and tables of the most popular social networks. Keep reading to find out why!
Reportei Dashboards x Excel Dashboards: how are they different?
Previously, on our blog, we covered the topic of Excel dashboards and why spreadsheets are not ideal for tracking results. Besides being less practical and intuitive, they can hinder your team’s productivity and communication with clients.
Automated reporting tools, like Reportei, came along to help you optimize your data analysis so you can spend less time capturing data manually.
Are you still wondering why Excel dashboards and Reportei dashboards are not the same? Dive into the details below!
Creating and updating dashboards
Creating an Excel dashboard from scratch is certainly no easy task. Though marketers can create their own templates, it can be challenging to build a dashboard that targets the needs of a particular project.
Updating your data can be quite complex since it’s not done automatically. Research is required to manually fill out each cell and keep everyone in the know when it comes to your results.
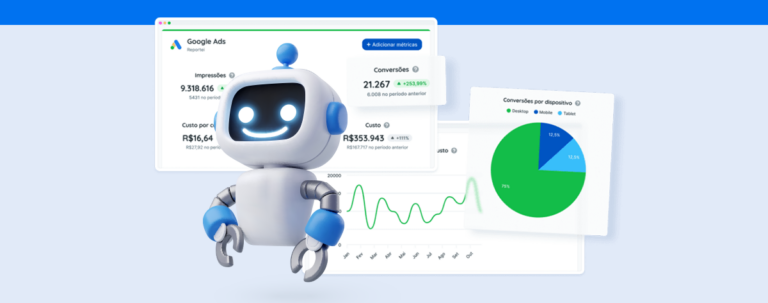
On the other hand, it only takes three seconds to generate Reportei dashboards, and all you have to do is integrate your social networks to our platform. You can then create unlimited dashboards for your clients.
And upgrading your dashboard is just as practical! Anyone with a link to the dashboard (team members and clients) can switch the dates at will to compare data between periods.
Data that is easy to read and interpret
Let’s say you created an Excel dashboard to analyze your digital marketing data. The model may look quite complete and well organized. But is it easy to read and interpret results? Is it intuitive? Is the information clear and easy for your team, especially clients, to understand?
It’s fundamental to keep this in mind for the best experience as far as analyzing results and speeding up decision-making. That’s what dashboards are for, after all, right?
Reportei prioritizes models that make it easy to understand results, with metrics signaling growth and downshift, graphs, and tables.
And since not everything is set in stone, you can customize your reports and dashboards through any of the following:
- Adding, removing, or ordering metrics at will;
- Reorganizing social networks to highlight the most relevant to a project;
- Editing graphs and tables;
- Adding your insights as texts, videos, or images, and the list goes on!
Optimize team productivity
Of course, these factors affect the team’s work dynamic and day-to-day priorities. Wouldn’t it be more practical to devote your time to analyzing results instead of building Excel dashboards and capturing data manually?
Marketing analysts can then direct their attention toward planning more efficient project strategies which result in high-quality projects.
That means higher returns and satisfied decision-makers, which will likely help boost your agency’s client portfolio, for example.
Spreadsheets, on the other hand, might not only result in time-consuming analyses but also require training and expertise in any advanced Excel features you may need.
Communication with clients
And speaking of clients, they’ll also have an easier time monitoring results when they are displayed in a practical, intuitive dashboard.
Even if the decision-maker isn’t keen on digital marketing, automated Reportei dashboards will simplify understanding of results and allow them to browse through different periods in the project timeline.
On the other hand, Excel dashboards can give your clients a hard time analyzing data and affect their taking part in marketing actions.
And as we mentioned before, you can customize Reportei reports so that they only display data relevant to the decision-maker.
Try our dashboards free for 3 days
To sum up, when comparing Excel and Reportei dashboards, you can tell why it’s worth it to invest in an automated tool. You’ll optimize data collecting and smooth out communication among team members and with clients.
To top it off, Reportei has a few more benefits to help you communicate with clients more effectively. You’ll also be able to:
- Create unlimited static reports;
- Build a timeline to record project history;
- Select your dashboard settings and automatically send reports to your team or clients.
What are you waiting for? Try Reportei now and see why our dashboards are more complete and practical than Excel’s.


