Learn about the available metrics in the Google Ads report, new features from Reportei, and how to gain better insights for your strategies
Focused on helping you perform more efficient analyses of your campaigns, Reportei’s Google Ads report not only provides an overall account performance overview but also specific metrics on the performance of ad groups, creatives, and keywords.
Over time, we’ve also worked to further refine the tool and offer solutions aimed at providing more precise insights into campaigns and measuring financial returns from paid media investments.
Not familiar with the Google Ads report and the metrics captured automatically? Don’t worry, we’ve prepared this article to present all the performance data you find and the new features launched in 2023. Keep reading!
Google Ads Report: Key Metrics Available
By generating your report or dashboard in Reportei, you can import all the information about paid campaigns that ran during a specific period – whether it’s recent or a look back at previous years, depending on the data stored in the account.
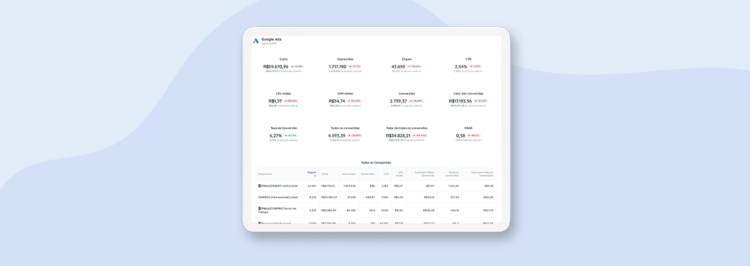
In just a few seconds, our tool captures the following metrics:
- Impressions and clicks;
- Total number of conversions;
- Click-through rate (CTR);
- Conversion rate;
- Cost per Conversion;
- Cost;
- Average Cost per Click (CPC);
- Average Cost per Thousand (CPM);
- Return on Advertising Spend (ROAS).
Beyond giving you an overall view of the account’s performance from these data, Reportei also offers tables to assist in specific analyses of campaigns, ad groups, and main keywords.
Additionally, other information is available in these tables, depending on the ad format. Among them, the highlights include:
- Campaign type;
- % of ads in the 1st position;
- Video views and view rate;
- Number of calls;
- Interactions and interaction rate.
The graphs focus on providing a more visual analysis of the relationship between clicks and CTR, conversions and conversion rate, cost and CPC, among other metrics listed above. If you prefer, you can also create/edit graphs and tables to customize the information according to project needs, adding or removing metrics.
This allows for a detailed and integrated view of what worked during the period, the necessary improvement points to boost results, and which actions to bet on to increase the ROI of paid traffic campaigns.
New Metrics in Graphs and Tables
But that’s not all. In 2023, our team also worked to import other important data that will help both in your analysis and in communicating results with the client. Here are the new metrics:
- Campaign status (whether it’s active, paused, or ended);
- Cost per video view;
- Ad quality: an index evaluating factors related to the experience provided by the creative;
- Lost impression share due to budget (search network);
- Lost impression share due to ad rank (destination);
- Lost impression share due to budget;
- Search network impression share;
- Conversion value;
- ROAS for each campaign, ad group, and keyword.
To add the new metrics to the Google Ads report, just click the button available in the upper right corner of the document or access the settings (gear icon) of your tables.
Moreover, speaking of tables, we now also have one with the performance of the “Top text ads” aired during the period, to aid in the analysis and optimization of creatives. Thus, it becomes easier to identify the quality of each ad, make adjustments, and achieve better returns.
Individual Campaign Analysis
Although not a novelty, it’s worth highlighting the individual campaign analysis functionality in Reportei’s Google Ads report as well.
Besides the table showing the main metrics, you can capture data from the most important campaigns to obtain more valuable insights, and give greater emphasis to this information during the report presentation – since they are allocated in a separate block in the document.
Generate Google Ads Reports in a Few Clicks
Best of all, all the above information is captured by Reportei in just a few seconds, helping you and your team dedicate more time to the most important parts: more precise analyses and strategic decision-making.
Even if not all the data listed above appear in the document at first, there’s the possibility to customize the template to add them and change the order in which they’re presented, highlighting what’s most relevant for the project and communication with the client.
After creating a customized layout, you can save it and use it as many times as you want, in the same or other projects.
Enjoy Other Features for More Efficient Analyses
Beyond generating reports and dashboards for Google Ads, Reportei also offers other relevant functionalities that help in monitoring your results and performing tasks more efficiently. Check them out:
- Indicator control: an exclusive panel to monitor important project indicators. This way, you can more quickly view the progress of each goal, receive warnings about conversions and expenditures, and make more agile decisions to reverse negative scenarios;
- Report automation: create and send automatic reports (weekly, bi-weekly, or monthly) without needing to access the app for it. This optimizes the process and increases team productivity;
- Marketing Timeline: a different way to record project advances, creating a complete history of your actions and results, whether to keep the entire team on the same page or increase engagement with the client.
With all these resources, it becomes much easier to perform precise analyses of your Google Ads campaigns and go beyond in paid traffic strategies.
Take advantage of our 3-day free trial and discover how Reportei can help make your team’s routine more productive!