The future of Google Ads Reports
In addition to making it easy to analyze campaign and ad performance, the Google Ads Report also has the goal of displaying the media investments in a more transparent way for the client.
After all, several metrics can influence how you interpret the information and plan the actions needed for the future of the project.
Far beyond the total cost and amount of clicks, the decision-maker needs to understand what Google Ads delivers and how this tool is essential to his/her digital marketing strategy. Here is a list of 3 essential tips to create a Google Ads report that is easy to understand and effective in communicating results to your client.
1. Customize the template of your Google Ads Report
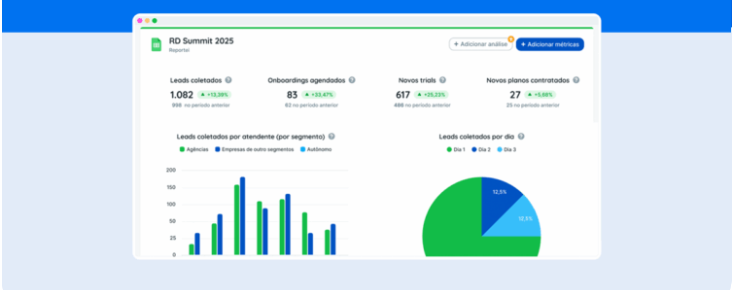
With the new customizable version of Reportei, you can create specific templates for each client and save them for use later.
Changing the layout of the Google Ads Report, for example, allows you to add, delete, or highlight metrics that are important for analyzing your campaign results.
From this, your client can see, in a more practical way, how the money was invested and what information is relevant to the development of new action plans for the project.
All templates are available in the report creation screen and can be used with any client registered in Reportei.
2. Emphasize the most relevant metrics
When submitting your Google Ads Report to the client, you should ideally highlight the metrics that show how the campaign performed and what improvements can be made for the next month.
Far beyond impressions, clicks, and total cost, you need to draw the client’s attention to the data that reveals whether your investments generate a return for his/her business.
Below, you can check what information can not be left out of your report and should be the basis for more strategic planning of your Google Ads campaigns.
Click-through Rate
One of the most important metrics for analyzing the Google Ads Report is the Click-through Rate (CTR), which is the total number of ad clicks divided by the number of impressions.
The CTR is linked to the performance of your campaigns, and therefore, it deserves special mention in its analysis.
The higher your CTR, the better your campaign results are, as your ads are receiving clicks and directing visitors to your client’s website.
However, if your rate is decreasing, it means that it is time to revise your strategy and plan actions that will put you ahead of the competition.
Cost per Click
Along with the CTR, you should evaluate the Cost Per Click (or CPC), which shows, on average, how much each click on the ad cost you. CPC is calculated by dividing the total amount invested by the number of clicks in the campaign.
The lower your ad’s CPC, the higher the Return on Investment (ROI), since your campaign can achieve more clicks without changing the amount invested.
Therefore, CPC is an essential metric both to control the budget of Google Ads and to analyze ad performance.
Conversion rate
The Google Ads Report Conversion Rate shows the number of conversions divided by the total number of clicks on a particular ad.
Conversion happens when a person clicks on the ad and takes action.
This metric therefore helps to assess how users coming to the site behave and to define strategies that are most effective for converting visitors to potential clients.
Ad groups and keyword summary
The essential Google Ads Report metrics (impressions, clicks, conversions, CTR, and CPC) can also be analyzed separately in the table of ad groups and a summary of keywords used.
These two tables were created with the purpose of assisting in the evaluation of the actions that are generating the expected results.
Ad group analysis also allows you to see what the average position of each group in the Google ranking is.
By doing this, you can check how your campaigns are performing relative to the competition and think of strategies so that they always take the best place in the ranking.
Regarding the keyword summary, you can analyze which words are aligned to the campaign proposal and target the next ads to what the public want to find on Google.
3. Do analysis that helps complement data
One of the most critical points in reporting for any social media is the analysis that contains the opinion of the marketer, and it helps complement the data collected automatically by Reportei.
That’s why in our Google Ads Report, you can add as many open reviews as necessary so that your client understands the relevance of each information presented and actively participates in the decision making the process.
The focus should not only be on the results obtained, but also on planning for the future of the project.
After all, the client needs to know what the next steps will be and which actions will be taken for the project to reach its goal.
The analysis, above all, aims to generate customer engagement and improve communication between the company and marketing agency/freelancer.
This feature can be the differential so that your Google Ads Report is valid both to report the data and to initiate a dialogue with the customer and bring him/her closer to each stage of the project.
With proper open analysis, highlighting key metrics and using custom templates, your report will become much more objective, informative, and useful for the communication with your customer!
Did you like our tips on how to generate your Google Ads Report on Reportei? Then log in to your account or register on our site to test this news!