Check out our guide on the key metrics to analyze in different types of marketing reports, such as inbound, paid traffic, social media, and more!
Essential for the success of any digital marketing strategy, metric analysis allows you to track the performance of your actions and provides insights that guide you towards the best business decisions.
However, with so many data available in a marketing report, it’s crucial to know which are the key metrics to monitor, taking into account the objective and goals of the project.
Therefore, in this article, we will explore what data should be considered when evaluating different aspects of online performance – such as inbound strategies, website traffic, social media engagement, SEO, and much more. Shall we?
Which Metrics to Analyze in Each Type of Report?
Below, you’ll find the list of most relevant metrics according to the reports of:
- Inbound marketing;
- Paid traffic;
- Social networks;
- Local business;
- SEO;
- Influence marketing.
Inbound Marketing Report
The inbound marketing report covers a variety of channels and metrics that help measure the performance of strategies aimed at attracting, converting, and closing deals with customers.
However, there are some main ones that serve as guides to understand which media are more relevant in the process of generating new leads and making them move down the sales funnel. Here are they:
- Website traffic: indicates how many users reach the site and how they do so, whether organically, through direct traffic, paid, referral, or social media. This way, it’s possible to identify which channels perform better and should receive more attention in the strategy;
- Conversion rate: measures the effectiveness of your landing pages and conversion forms. It shows the percentage of visitors performing a desired action, such as filling out a form or making a purchase;
- Leads and opportunities generated: total number of people who provided their contact information in exchange for a resource – like an e-book, webinar, or newsletter – or requested a quote, product demonstration, among other actions;
- Conversion rate from leads to opportunities or customers: indicates how many of the generated leads became business opportunities or customers. This helps to assess the effectiveness of your contact nurturing process and the quality of the leads you’re generating;
- Content engagement: includes metrics like email open rates, link click rates, social media shares, and time spent on the site, which helps to evaluate the audience’s interest and interaction with your content;
- ROI (Return on Investment): is essential to evaluate the financial return of inbound marketing campaigns in relation to the total cost. That is, it shows the value generated by the customer’s investment in the project.
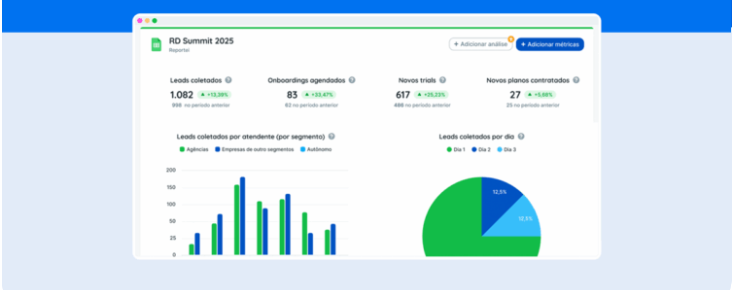
Additionally, at Reportei, you have access to an inbound marketing report template, which provides a visualization of metrics from the bottom to the top of the funnel – starting with a highlight on the results of marketing automation tools.
Paid Traffic Report
Meanwhile, the paid traffic report should focus on metrics that help assess whether the investment in advertising generates positive results. Therefore, some of the data to be considered are:
- Impressions: shows how many times the ad was displayed to users. Although not a direct performance metric, impressions can help assess the campaign’s visibility;
- Click-through rate (CTR): shows the percentage of people who clicked on your ad after seeing it. A high CTR generally indicates that your ad is relevant and attractive to users;
- Cost per click (CPC): indicates the average cost paid for each click on an ad. This metric helps understand if you are spending too much or too little to bring visitors to your pages;
- Conversion rate: shows the percentage of people who performed a desired action after clicking on your ad, such as filling out a form or making a purchase;
- Cost per acquisition (CPA): represents the average cost to acquire a lead or customer through a paid traffic campaign. It’s calculated by dividing the total campaign cost by the number of conversions;
- ROAS (Return on Advertising Spend): evaluates the financial return of your paid traffic campaigns in relation to the total cost. That is, it’s the most important analysis to understand if the investment is really paying off for the client;
- Average ad position: finally, it’s the metric that indicates the average position where your ad was displayed in search results or on other advertising platforms. A higher position usually results in greater visibility and potentially more clicks.
By analyzing these metrics together, you can start to assess the performance of your paid traffic campaigns on channels like Google Ads, Meta Ads, TikTok Ads, and much more.
Social Media Report
In the social media report, it’s crucial to monitor metrics related to the profile’s reach and engagement with the audience – and how this interaction reflects on website traffic and customer acquisition. Among the main data, it’s worth highlighting:
- Engagement: includes likes, comments, shares, and clicks on your posts, which shows the level of interaction of your audience with the content you share and indicates how relevant and interesting are the posts to your audience;
- Reach: indicates how many people saw your content and can be divided into organic (unpaid reach) and paid (resulting from ads). Tracking this metric helps understand the visibility of the posts on networks like Instagram and TikTok;
- Impressions: counts how many times the content was displayed in users’ feeds, regardless of whether to the same user or different users;
- Profile clicks: indicates the number of clicks on a link or call to action (CTA) in your profile, which helps understand how people are being redirected to the website, WhatsApp, or other points of contact with the brand;
- Followers and follower growth: monitoring the number of followers on your social pages or profiles and the growth of this number over time allows understanding the size and reach of your audience.
Moreover, it’s essential to monitor not only the quantity of interactions on the posts but also the content of comments and feedback that the brand receives from followers.
Local Business Marketing Report
When preparing a report for a local business, it’s crucial to consider metrics related to paid and organic traffic actions on social networks and Google. Check out some of the main ones to be analyzed:
- Search engine visibility: this includes data like the position in Google’s local search results and other search engines relevant to your region. This helps to assess your company’s visibility in the area it operates and how it stands out in relation to the competition;
- Reviews: the quantity and quality of reviews received on platforms like Google My Business, for example, are important indicators of the brand’s reputation.
Metrics such as average rating, number of reviews, and sentiments expressed in comments can provide insights into public perception; - Local site traffic: analyzing visits by region can help understand where these people are coming from. For this, you can use Google Analytics to identify the geographical location of users and adjust strategies according to traffic patterns;
- Conversions: whether online or offline, it’s important to track the number of forms filled out, orders placed, phone calls made from clicks on local ads, or store visits;
- Local search traffic: refers to the number of people finding your business through local searches, like “restaurants near [neighborhood name]” or “plumbers in [city name].” This analysis allows understanding the effectiveness of local search engine optimization strategies and which keywords can be explored to achieve the first place in ranking;
- Local visitor conversion rate: This refers to the percentage of local visitors to your site who perform a desired action, such as making a reservation, scheduling a service, or buying a product.
It’s worth noting that Google My Business is one of the most important tools when it comes to local businesses, and its reports offer a very detailed view of how users reach the company profile and the actions they take to interact with it.
SEO Report
In the SEO (Search Engine Optimization) report, it’s essential to track metrics that help not only to assess the site’s performance in search engines but to identify opportunities to apply techniques for optimizing the pages, such as:
- Keyword positioning: monitoring your site’s position in search results is crucial. This includes tracking the terms for which the site is ranked and whether it’s gaining or losing positions;
- Organic traffic: indicates how many visitors the site receives from organic search results, which helps to monitor over time the effectiveness of SEO strategies;
- Click-through rate (CTR): shows the percentage of users who click on your site after seeing it in search results. A high organic CTR is the result of good positioning, in addition to indicating a relevant title and meta-description for users;
- Engagement rate: a Google Analytics 4 metric that refers to the number of users who interacted with the site. That is, who didn’t leave without taking an action;
- Pages per session: shows how many pages users visit on average during a session on the site. A high number of pages per session indicates that users are exploring your site more and finding value in various contents;
- Organic conversion rate: indicates the percentage of organic visitors who perform a desired action, such as making a purchase, filling out a form, or subscribing to a newsletter.
In addition to tracking SEO metrics through Analytics, it’s essential to generate reports in Google Search Console – a tool focused on assisting in improving organic performance.
Influence Marketing Report
For those betting on influence marketing, the metrics report should assess the performance of campaigns and measure the impact of influencers on brand development. That is, it should consider:
- Reach: total number of people who saw the content promoted by influencers, such as the number of followers, post views, and potential reach;
- Engagement: shows how the audience is interacting with the partnership content, including likes, comments, shares, and clicks on links. A high level of engagement can mean that the content is generating interest and involvement from the audience;
- Conversion rate: indicates the percentage of the influencer’s followers who perform a desired action after being exposed to the content, such as making a purchase using an exclusive discount coupon, for example;
- ROI (Return on Investment): evaluating the ROI of the influence marketing campaign is crucial to determine its financial success. This involves comparing the cost with the benefits generated, such as increased sales, follower growth, or lead generation;
- Follower growth: monitoring the growth of your brand’s follower count on social networks during and after the influence marketing campaign can indicate the positive impact of the same.
Just like in the social media report, the influence marketing report requires a qualitative evaluation of the content shared in partnership with the influencer. That is, beyond engagement numbers, it’s necessary to know how people are receiving the campaign and reacting to it.
Generate Custom Marketing Reports with Reportei
Now that you know which are the main metrics to be analyzed in each type of marketing report, it’s important to remember that you can count on Reportei to capture them automatically and make your analyses much more practical in your routine.
After all, our platform integrates with more than 20 channels – such as Instagram, Facebook, Meta Ads, Google Ads, TikTok, LinkedIn, RD Station, among others – to generate reports and dashboards in seconds.
Additionally, you can use our artificial intelligence tool to create automatic analyses on the captured data, allowing you to direct all your effort towards making the best decisions for the project.
Take advantage of our 3-day free trial period to discover these and other features that make your marketing reports much more efficient and accurate!