Reportei is more than social media reports
Did you know that Reportei’s report goes far beyond the metrics and extensive analysis of social media results? Along with the new customizable version we recently launched, we also have other features that make it easier for both the analyst’s work and customer understanding.
We have gathered 3 of these features, which will make the analysis of results and your communication with the customer even more strategic. Keep reading and check out everything you can do with your Reportei report!
1. Generate a Reportei’s report from up to 2 years in the past
When generating a Reportei’s report, you have the option of accessing all the data that Facebook and other media provide about the history of your customer’s accounts.
Typically, this information becomes available for two years (up to 3 years in some cases) and is excellent for understanding the customer’s history.
Besides, they are also a great guide to assess what actions will be needed for the future.
So whether you want to know the results before starting a project or make data comparisons, this is a feature that makes a big difference in the development of your analysis.
Also, the Reportei’s report provides metrics related to the audience that interacted with the ads, showing reach and impressions by age, gender, time, and platform (mobile or desktop).
Now that you know these three features of Reportei, it’s much easier to generate complete reports and offer detailed analysis to your customers!
Not our customer yet? Then sign up on our website and start generating reports from Reportei for free for three days!
2. Create an interactive Timeline with embedded videos and images
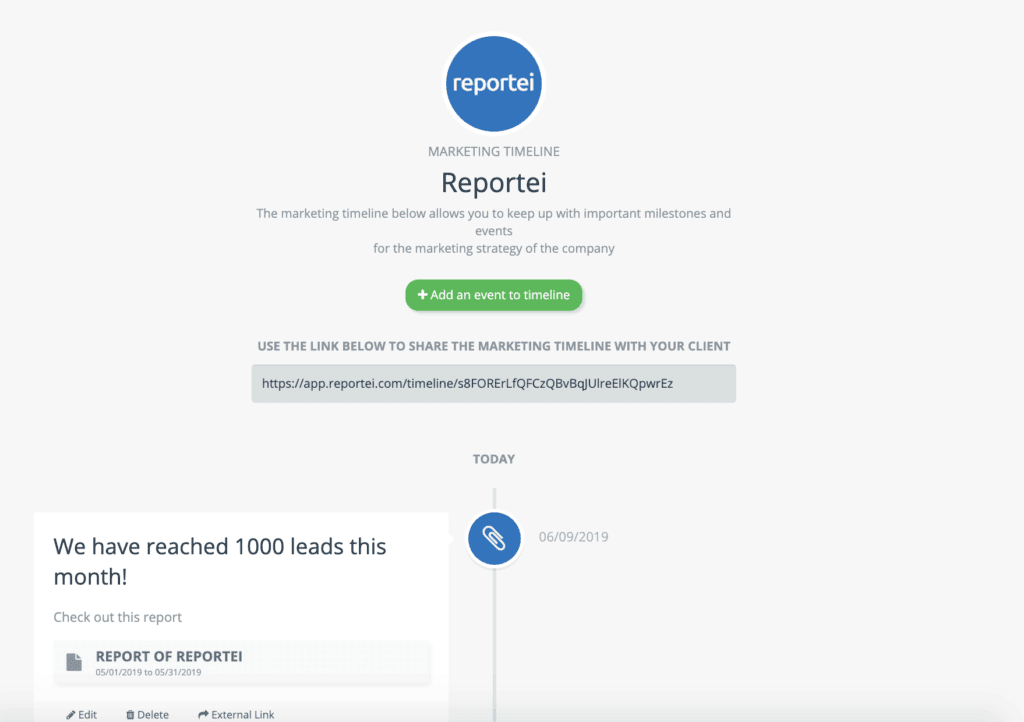
In September 2018, we launched a feature that helps agencies and freelancers to follow each project step-by-step in a more interactive way for their clients: the Reportei Marketing Timeline.
Its primary function is to show the company’s milestones through “stories” that bring the decision-maker closer not only to the results but also to the creative process that made them reach their goals.
After all, there are many new developments over a month of work, and if the customer well informed of the details, the communication will become more evident, and the relationship improvement will be continuous.
Because it is an interactive resource, you can even incorporate videos and images that complement the information and make the Timeline more interesting.
An excellent way to work with images, for example, is to use the planned parts and screenshots to show the evolution of a campaign during its active period.
In this way, a customer does not only see the “tip of the iceberg,” but the whole path to results.
With the Timeline, you can also create a history to analyze your past actions and prioritize future planning.
To learn more about Reportei’s Timeline and the improvements it can provide to your strategies and your relationship with customers, click here!
3. Generate a detailed report for each Facebook Ads campaign
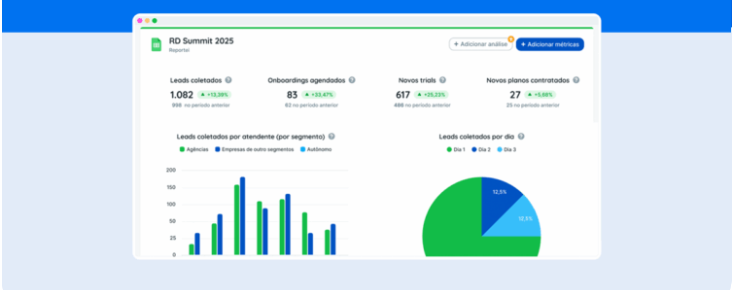
When generating a Facebook Ads report on Reportei, you have the option of analyzing your entire ad account or select and receive campaign-specific data.
This in-depth analysis of results is a feature that makes it easier to evaluate the strategies that worked and study to create content as well as ad templates more focused on what the audience wants to consume.
This data is essential to present how the investments in Facebook Ads are made and guide the next steps of the project.
In each campaign, you can analyze data for reach, impressions, amount invested, clickthrough rate, frequency, CPC (Cost per Click), and CPM (Cost per Mille Impressions).
The actions performed by the users are made available in a table and show what types were found (engagement and reactions to the posts, for example), how many were performed and what the cost of each one was.