Explore the features of Power BI and Reportei dashboards and discover the main differences between the two tools.
In the current business landscape, data analysis has become essential for tracking metrics and making strategic decisions. Thus, tools like Power BI by Microsoft and Reportei stand out in creating dashboards that facilitate this process, allowing for clear and accessible visualization of critical information.
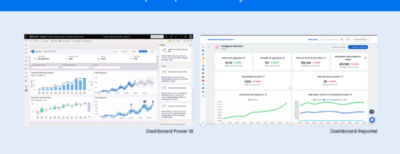
But what are the main differences between the dashboards created in the two platforms and which one to choose to meet your needs?
In this article, we will explore the strengths of each tool, their target audiences, and the ideal usage scenarios. Follow along.
What is Reportei
To start, Reportei is a platform developed to make result analysis more agile, productive, and comprehensive, especially in the context of digital marketing and sales.
Focused on saving time, the tool automates the creation of reports and dashboards, which facilitates the daily routine of professionals who need to track metrics quickly and efficiently.
From this, the Reportei dashboard includes all the data, graphics, and tables you would find in a static report but with the advantage of allowing alternation between different analysis periods and comparison at any time.
This way, it eliminates the need to generate multiple reports throughout the week or wait until the end of the month to get insights, significantly accelerating decision-making.
Additionally, Reportei allows the customization of the panel and direct sharing with clients. This means they can navigate through metrics in real time and closely follow the results of executed strategies, which increases transparency and strengthens the relationship between the parties.
Target Audience
That said, the Reportei dashboard is ideal for agencies, freelancers, traffic managers, and companies seeking a more practical way to monitor and present data to clients.
Currently, over 10,000 professionals and organizations use the platform to facilitate communication of results.
Similarly, like the Power BI dashboard, its focus is to provide essential information that demonstrates the success of implemented strategies and assists in planning future actions to further improve performance.
Types of Analysis and Metrics
With Reportei, it is possible to view and analyze in a single screen the main indicators of more than 20 channels, including:
- Social Networks like Instagram, Facebook, LinkedIn, TikTok, and Pinterest
- Advertising platforms Meta Ads, Google Ads, TikTok Ads and more
- Marketing automation tools RD Station and Hubspot
- Ecommerce and CRM integrations with ecommerce platforms like Shopify and Woocommerce, and customer relationship management systems like Pipedrive and RD CRM
Finally, the platform also offers insights generation with artificial intelligence making data analysis even more powerful and assertive.
With this, professionals identify trends, opportunities, and improvement points faster and more efficiently.
What is Power BI
The Power BI platform is a unified and scalable Business Intelligence (BI) option developed by Microsoft.
Known for its robustness and flexibility, the tool allows users to connect to a wide variety of data sources, visualize complex information, and incorporate advanced visuals into daily-used applications.
In other words, it’s a comprehensive solution for companies looking to centralize all information in a single dashboard model. In addition to marketing and sales, the platform can integrate data from areas such as:
- Sales performance analysis and sales forecasts
- People management human resources indicators and talent retention
- Team productivity monitoring of efficiency KPIs
- Inventory management inventory control and product turnover
Target Audience of Power BI
From this description, we can see that Power BI is aimed at companies that need in-depth and customized analyses, covering multiple business areas.
Thus, it is ideal for organizations that wish to consolidate large volumes of data and extract detailed insights to support strategic decisions at all levels.
Due to this, the tool requires a greater investment of time for configuration and training, being more suitable for teams with technical knowledge or resources to invest in specialized professionals.
Types of Analysis and Metrics
Being quite extensive, the platform collects data from various sources such as:
- Excel and CSV files;
- Internal databases SQL Server, Oracle, etc.
- Cloud services, like Google Cloud
- APIs and online services, social networks and marketing platforms.
Thus, with all these integration possibilities, Power BI allows you to:
- Connect all data sources in a unified environment, establishing a single source of truth for all company data.
- Combine enterprise-scale and self-service BI, allowing different users within the organization to generate their own insights.
- Integrate with other Microsoft applications, such as Excel, Teams, and SharePoint, which facilitates collaboration and information sharing.
Main Differences Between Power BI and Reportei
Although both offer powerful dashboards, Power BI and Reportei have distinct proposals that meet specific needs. Below is a more detailed comparison between the two platforms.
Ease of Use and Implementation
When we talk about ease of use, Reportei stands out as an instant solution with a focus on practicality and speed. It does not require complex configurations, making it ideal for professionals who want to start monitoring marketing and sales metrics immediately.
On the other hand, Power BI offers a robust and highly customizable platform, but it requires a greater investment of time for configuration and learning.
Thus, it is more suitable for companies that require detailed analyses and have resources for implementation and training.
Type of Data and Available Integrations
Focused on digital marketing and sales, Reportei integrates with more than 20 relevant channels in these areas. Therefore, it is perfect for professionals who need quick and specific insights for their social media strategies, paid traffic, SEO, CRM, ecommerce, and more.
Meanwhile, Power BI allows connection with a wide variety of data sources, including internal systems and cloud services. It helps consolidate information from different departments and business areas into a single dashboard.
Cost-Benefit
In terms of pricing, Reportei offers plans starting from 12x R 48.93, including 5 projects and 3 users. Thus, it is an affordable option for small and medium businesses, agencies, and freelancers seeking an efficient solution without a large investment.
On the other hand, Power BI has a limited free plan and paid plans starting at R 59.50 per user/month. Although the cost per user is higher, its advanced features are suitable for companies needing more comprehensive analyses and willing to invest in a more complex tool.
Try Reportei for free
In other words, if you are looking for a practical and immediate solution to monitor marketing and sales metrics, Reportei may be the ideal tool for your business.
With an intuitive interface and integration with the main communication and digital marketing channels, we facilitate the daily lives of professionals who need to make quick decisions based on accurate data collected in reports and dashboards.
Try Reportei now and discover how we can optimize the monitoring of your projects. Take a free trial and see in practice all the benefits we offer for your company.