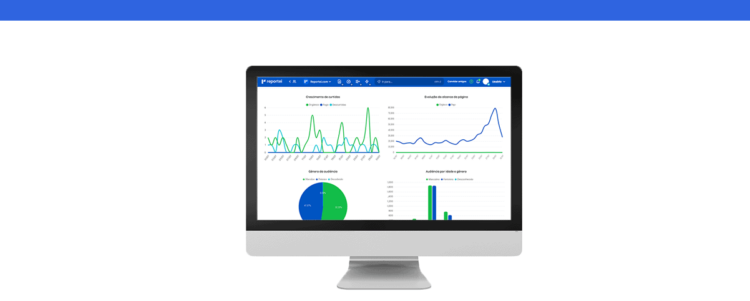
Beyond to the standard report template, you now also have templates focused on Inbound Marketing, Paid Traffic, and E-commerce.
If your project’s main focus isn’t social media, here’s some good news: at Reportei, you can find report templates focused on Inbound Marketing, Paid Traffic, or E-commerce projects.
These three models, along with our classic report (which prioritizes Instagram and Facebook results), are now available in version 4 of the software and bring a sequence of channels and metrics more aligned with your client’s goals and objectives.
Below, we detail everything you need to know about Reportei’s report templates and how to make them even more aligned with the project decision-maker’s expectations. In this article, we cover the following topics:
- Reportei report templates focused on client objectives
- Template for Inbound Marketing projects
- Template for Paid Traffic
- Template for E-commerce
- Template for Social Media (Standard)
- How does report customization work in Reportei?
Reportei report templates focused on client objectives
Within the digital marketing universe, we know there are various solutions that can be delivered to clients, such as social media management, content marketing, media and performance, or even a complete Inbound Marketing project.
Just as the scopes of each of these are different, so are the indicators and goals analyzed, which changes priorities when presenting reports to clients.
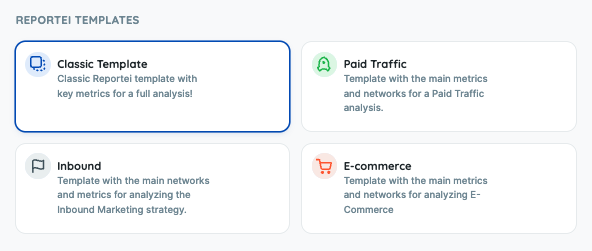
With this in mind, in addition to giving you the possibility to develop your own models, we now also offer four templates for reports that assist in defining the channels and metrics that should be highlighted for your client.
These models are focused on Inbound Marketing, Paid Traffic, E-commerce, and Social Media (standard) projects, but soon, we will also have others aligned with different services delivered in the digital environment. You can choose them right at the first step of creating a new report, as shown in the example below:
Next, learn how each template’s display order works:
Template for Inbound Marketing Projects
The Inbound Marketing template arranges channels in a way that facilitates the analysis of the sales funnel. Therefore, the report starts with presenting results from CRM (if integrated) and RD Station Marketing.
While in the standard model, Inbound metrics appear at the end of the report, in this version, data is displayed at the top of the document, immediately showing numbers related to conversions, qualifications, opportunities, and sales.
Next, you’ll have access to metrics related to website traffic, most visited pages, and traffic origin through Google Analytics, and organic positioning through Search Console.
Then, it’s the turn of paid media channels (Google Ads, Facebook Ads, and LinkedIn Ads), making it possible to analyze the investment and results of each campaign. The list continues with the main data from social media, such as follower gain, reach evolution, impressions, and performance of each post.
Finally, if you also have Mailchimp integrated into Reportei, you can analyze email marketing metrics delivered by actions in this channel.
Template for Paid Traffic
The Paid Traffic template focuses on paid media that can be integrated into our platform, considering channels like Google Ads, Meta Ads, LinkedIn Ads, TikTok Ads, and Pinterest Ads.
This model is very comprehensive and facilitates a detailed analysis of the results of each ad. As highlight metrics, we have: invested value, conversion rate, Cost per Click (CPC), Cost per Thousand Impressions (CPM), and Click-Through Rate (CTR).
The sequence provided after these initial channels presents data from Google Analytics, RD Station, and, finally, the complete metrics of social networks.
In other words, you don’t lose any information by using the new report templates from Reportei; you just display data and analyses according to what is most relevant for the project.
Template for E-commerce
Now, if you have a client or company in the e-commerce area, we also created a specific layout for this business model. Here, the focus is primarily on the website, with the Google Analytics report appearing first.
Moreover, the metrics prioritized in this template are those of e-commerce, highlighting the Conversion Rate, Revenue, Number of Transactions, and Abandonment Rate. Thus, if there is a complete integration between Analytics and the site, data capture will be more efficient.
After that, user behavior data comes in, related to Sessions, Session Time, Bounce Rate, and Traffic Source channels.
Next, we add data from paid traffic, which is essential to understand how investment in ads redirects to the virtual store. Lastly, we have the metrics of content broadcasted on the business’s social networks and reports from marketing automation tools.
Template for Social Media Reports (Standard)
The Standard template from Reportei is known as such because it was the first to be developed by our team when our main focus was on social media metrics.
Therefore, when generating this report, you will first see media like Instagram, Facebook, LinkedIn, Pinterest, and TikTok. Its goal is to present the development of your content and presence on these networks.
Afterward, you can view Social Ads channels, such as Facebook and LinkedIn Ads, in addition to information from Google Analytics, Google Ads, and finally, automation platforms.
Thus, the classic layout is the right choice when the decision-maker wants to prioritize social media information or if you want to customize reports by creating and saving your own template.
How does report customization work in Reportei?
It’s worth mentioning that Reportei’s report templates do not interfere with a function we’ve had since version 3 of the platform: the ability to customize and save templates according to what is most relevant for each of your projects.
Therefore, when creating a new report, you can opt for our models — which include the Standard, Inbound, Paid Traffic, and E-commerce — or those you created and are available right below these first options.
When customizing reports in Reportei, you have the option to:
- Change the order of channels and metrics according to what is most relevant for your client’s business;
- Add manual metrics and charts, in case you miss some data that was not captured automatically;
- Add or remove metrics, charts, or tables;
- Include analyses in texts, images, or videos to complement the information obtained automatically.
After that, just click on “Save as template,” create a title that facilitates the identification of the layout, and save it to use in one or several projects!