Is a Report the same as a Dashboard? Learn everything about these two tools and how they can help you!
Right off the bat, we can say that, although both gather metrics and enable more efficient analysis of results, a report and a dashboard are quite different resources.
Both are commonly used in digital marketing projects, but with distinct and complementary purposes. In other words, ideally, one should not replace the other in your team’s daily routine.
Therefore, we’ve prepared this article specifically to explain the meanings of the report and dashboard concepts, among other information.
Make sure to read until the end of the article for the following topics:
- What is a Report?
- What is a Dashboard?
- Differences between Report and Dashboard
- Report or Dashboard? With Reportei, you get both!
What is a Report?
In a nutshell, a report is a static document that compiles all the metrics and analyses for a specific project period.
Through reports, it’s possible to record the history of your marketing strategies’ results and gain valuable insights for determining future actions.
Thus, if your team changes or someone new joins, the reports, with their in-depth data and analyses, will be the perfect source of information for anyone to follow a project’s progress.
What is a Dashboard?
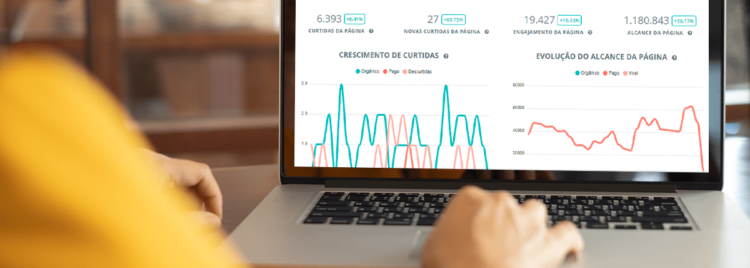
A dashboard, while also valuable for providing insights and helping to monitor results, is a more dynamic metrics panel. It allows you to generate data, analyze, and compare different periods without leaving the same page.
This makes control through this tool more agile, especially for those looking for quicker answers to questions or specific project situations.
The dashboard also enables decision-makers to closely monitor results, checking them in real time rather than just when the final monthly report arrives, for example.
Differences between Report and Dashboard
Now that we understand what reports and dashboards are, it’s time to delve deeper into the differences between these two tools and how they can assist in the evolution of digital marketing strategies and communication with your clients.
Know When to Use a Report
A report is an important ally that should (and must) be part of your team’s routine in various situations, such as:
- Providing the client or decision-maker with a more in-depth analysis of project results, complementing metrics with relevant text, video, or image information about your strategies;
- Extracting insights from a specific period and using them to define subsequent actions;
- Creating a history of results to facilitate the analysis of the project’s evolution over time.
Know When to Use a Dashboard
The dashboard should be your main source of information about results when you:
- Need to stay updated on metrics and activities in real time, seeking information more quickly;
- Want to interpret data and make decisions in a more dynamic way, as it allows you to access different periods on the same control panel;
- Wish to share information with your team, client, or decision-maker so they also stay informed about the results at all times, without waiting for the in-depth analysis of the report.
From these two lists, we can see that, despite their differences, reports and dashboards are complementary resources that can work together to provide a more complete view of project results.
– Also read: Sales Dashboard: 7 Benefits of Using the Tool
Report or Dashboard? With Reportei, you have both!
With Reportei, you don’t have to choose just one of these tools. Here, both report and dashboard are available so all our clients can determine the best way to communicate digital marketing results to their decision-makers.
Both can have customized templates and receive complementary analyses with text, videos, or images. However, while the report is delivered to the client in a static format, the dashboard can be shared for them to freely navigate different project periods.
Thus, while the dashboard facilitates the monitoring of key social media metrics on a daily basis, the report assists in a deeper analysis of specific periods.
The best part is that, with Reportei, both tools optimize data capture from various tools, such as Facebook and Facebook Ads, Instagram, YouTube, LinkedIn and LinkedIn Ads, Google Ads and Analytics, RD Station, Search Console, and much more!
This makes it much more practical to overcome the challenges of data analysis and focus on what really matters: developing marketing strategies that are truly effective for your client or company.
– Also, discover two other features that make Reportei the most complete tool for capturing and analyzing social media metrics: and Report Automation.
So, did you like learning how these two resources work in Reportei?
Then don’t waste any more time with manual preparation of reports and dashboards: register on our website and try the features for free for 3 days!