Reportei has a new feature to help make your analyses more productive. Now, you can create a dashboard for your project and generate and compare data much faster.
We have always aimed to help clients save time. We are now giving them complete control of reports without the need to create new ones constantly.
The Reportei dashboard is simple to use. Change dates to view metrics in a dynamic report adapted for professionals who deal with this kind of data regularly.
And the advantages don’t stop there! Keep reading to learn about how the dashboard can help you and your team on the go.
3 Benefits of using the Reportei dashboard
Our team developed the dashboard to make it simpler to analyze and compare data. Another aim is to help get your client/the decision-maker more involved with the project. Check out some of the benefits of using our dashboard below!
1. Access your metrics any time
Having access to your project metrics without the need to create a new report first is, no doubt, the main benefit of using our dashboard.
Whether you need specific data or full results for a social media account, your dashboard will be ready to show you in seconds.
That means you can control your entire project on one page. You will not have to wait until the end of the month to generate a full report or spend time creating several during the week.
Best of all, the dashboard is already available for all accounts (in beta version, as we will explain at the end of this article). You can create as many as you need, whether that’s one for each social media account or according to your particular strategy.
2. Select a period for comparing important data
Remember those times when a new client had just joined your agency, and you needed all the previous data to start planning?
How about when you are running a campaign one year, and you need to compare those of the previous year to gauge growth and understand what to improve?
Rather than generating a report for each of these scenarios, you can now compare all data through the dashboard. It’s faster and allows you to analyze different periods much more strategically.
Keep in mind, though, that some metrics will not begin computing before you link the social media account to Reportei, like Instagram Stories and RD Station, for example.
Pro tip: take the opportunity to add the data to your client’s Timeline. Create a history so you can go back and check it as needed!
3. Bring your client closer to project results
Undeniably, this is one of the most significant benefits of using the dashboard. As our clients know, we developed Reportei to improve and simplify your communication between professionals and their clients. It’s certainly true of our new dashboard!
You can share this control panel with the decision-maker of the project as well, so he or she can explore and follow the project-related data for themselves.
It will help your client feel less anxious about the results and might even get them to participate more actively in actions and decisions.
But before you send the link to your client, explaining how the dashboard works (as you would any other report) and what they will be able to view is essential. It’s important to stress how vital it is that the metrics you use fit your context and strategy. That way, your client will not be alarmed by possible negative results.
The more digital marketing savvy your client is, the handier they will find this feature, and the more effectively they will be able to use it.
How to create a dashboard on Reportei
Now that you know how our dashboard can make your life easier and improve communication with clients, check out the step-by-step on how to create one.
All you have to do is access your account and the first page of your client’s project, as you would for a report. Once there, follow these steps:
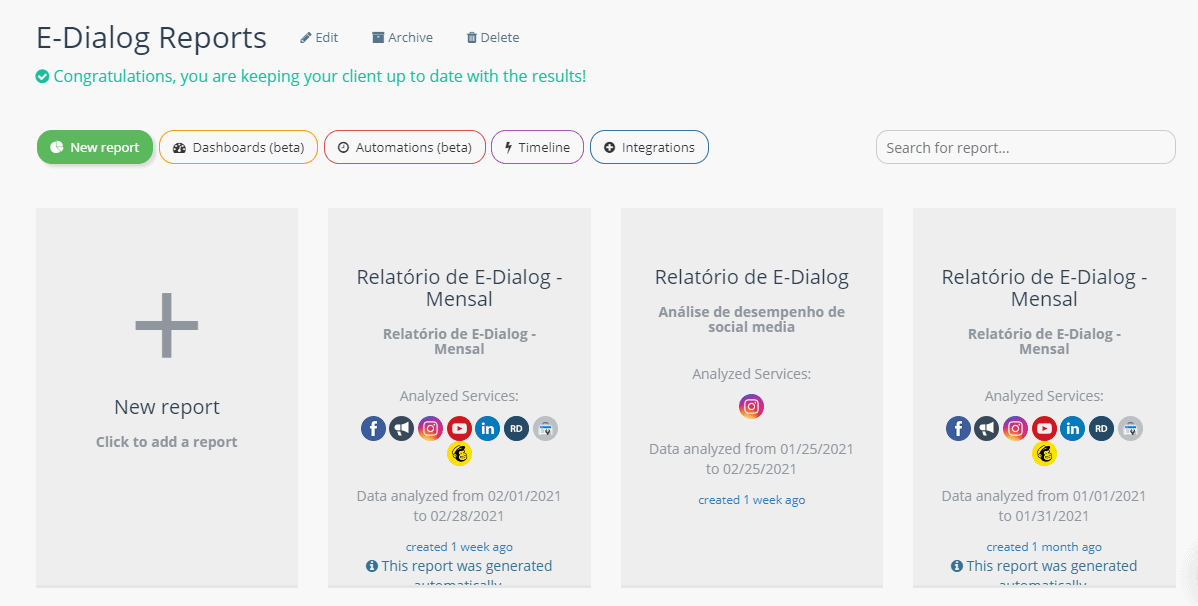
- Click on Dashboard (Beta) next to the button for creating a New Report;
- next, tap New Dashboard;
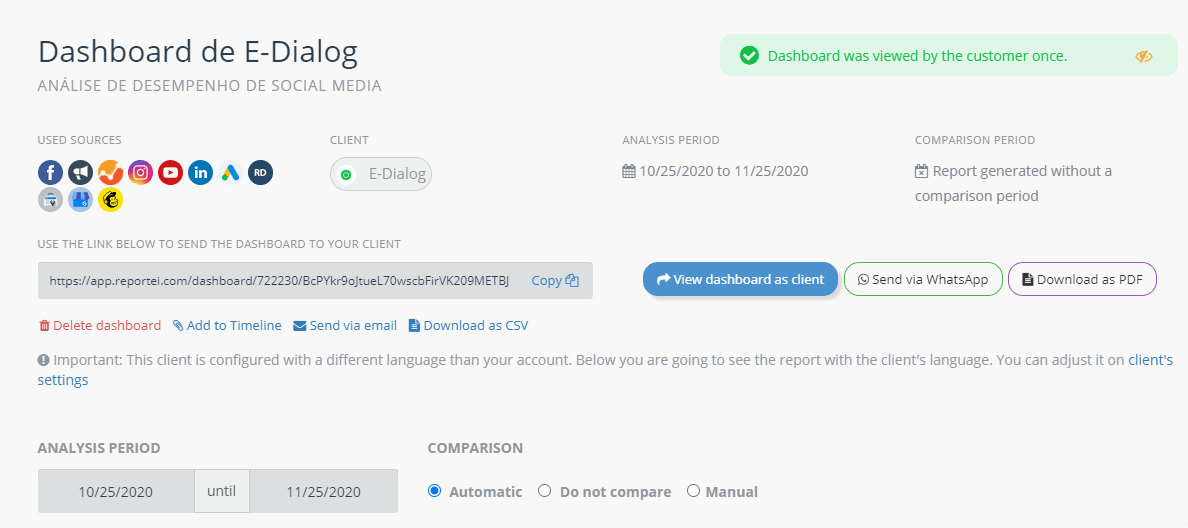
- choose a period to analyze and compare (you make changes to this later);
- choose which social media accounts to review;
- give your title a dashboard to finish.
Once you access the panel, you will notice the dashboard and report layouts are similar. The difference is that you can change the period of analysis and comparison whenever you need to.
You can use the dashboard to create exclusive templates, customize information, add or remove certain metrics, and reposition the social media sites according to what matters most to your strategy or the decision-maker of your project.
You can also add analyses in text, video, and image format to record important notes or instructions for the project. Share this feature with your client is a lifesaver.
The good news is that only a page manager can make changes to the dashboard template. When you send the link to your client, they will be allowed to change dates and follow different periods but cannot modify anything else.
Want to see how your clients view the page? Tap View as a client to check out their dashboard user experience.
Why is the dashboard in beta version?
As you access your account and create your first dashboard, you might be wondering why we released the beta version first.
Our team tested the dashboard diligently (as we always do before releasing new features) until it arrived at the model currently available on our platform.
But before we could certify that the dashboard was 100% suitable for the market, we invited our clients to try it out. That way, they could tell us if it delivered the results they expected and met their individual needs.
Feedback is essential to improving our product during that phase. Do you have any for us yet? Share it in the comments!
If you have already joined Reportei as a client, access your account to get up close and find out about all the ways this new feature can benefit your projects. Then, let us know what you think.
If you haven’t joined us as a client yet, run over and try out our dashboard, reports, and timeline free for three days.