
In digital marketing, data analysis is one of the most important steps for planning effective strategies and seeing if you are on the right path to achieving your goals.
Being such an essential phase, this means that it is also not a simple task, and it is very common for professionals in the field to face obstacles every time they generate a report and interpret it.
After all, some metrics can be much more complex than others, and therefore, collecting the right data from each analysis requires a lot of dedication and the use of specific tools to assist you in this process.
In this article, you will understand in more detail the concept of data analysis, the main types, and useful tips to generate good results in digital marketing through it. Continue reading!
What is Data Analysis?
Data analysis, in the corporate context, refers to the process of examining, interpreting, and extracting meaningful insights from a set of data related to a specific business activity.
It is from this analysis that the manager or responsible professional can discover useful information and devise assertive strategies on a particular subject or context to achieve results.
In marketing, data analysis involves evaluating data related to campaigns, customer interactions, product performance, and other relevant elements.
4 Types of Data Analysis
Among the various types of data analysis, four stand out: predictive, prescriptive, descriptive, and diagnostic.
Follow the topics below to understand more about each of them!
Predictive Analysis
Predictive analysis uses statistical models and algorithms to identify patterns in historical data and, based on these trends, make predictions about future events.
Here, technology is also a true ally for enabling increasingly in-depth studies.
In general, this type of analysis is crucial for companies looking to anticipate market demands, customer behavior, and trends, allowing for proactive decision-making.
Prescriptive Analysis
While predictive analysis anticipates what may happen, prescriptive analysis goes further, providing actionable recommendations to optimize results.
In other words, prescriptive analysis seeks to evaluate the consequences that certain decisions might bring. This approach uses advanced algorithms to suggest specific actions that maximize performance.
Prescriptive analysis is vital for guiding business and marketing strategies in the most advantageous direction.
Descriptive Analysis
Descriptive analysis is often the starting point for many organizations, as it focuses on the description and summary of existing data.
In this case, graphs, tables, and descriptive statistics are used to provide a clear view of the current state of operations, and therefore, this analysis is essential for understanding key metrics, identifying patterns, and evaluating current performance.
Diagnostic Analysis
Finally, diagnostic analysis focuses on understanding the causes behind certain results or trends.
By identifying the factors that contribute to the success or failure of a campaign, for example, companies can adjust their strategies more precisely.
Thus, diagnostic analysis is crucial for learning from the past and avoiding recurring mistakes.
The Main Challenges of Data Analysis
Being such an essential phase, this means that data analysis is not a simple task, and it is very common for marketing professionals to encounter obstacles every time they generate a report and interpret it.
After all, some metrics can be much more complicated than others, the dedication of time to collect them can be enormous, and even communicating this information can be a challenge.
Want to know more? Check out the following five adversities of data analysis in digital marketing projects and essential tips to overcome them.
- Difficulties in Interpreting Data
The truth is that each social media has a series of metrics that tell a lot about the results of your strategies and actions for these channels, whether you are achieving your goals and, consequently, your objectives.
However, in many cases, marketing professionals have difficulty interpreting these data, individually or in a group, and knowing which ones to focus on when conducting their analyses.
The first point to consider is that individually each metric will have its meaning, but alone they don’t say much about the project’s performance.
Therefore, before jumping to conclusions when seeing an isolated data point, it’s necessary to understand the whole picture.
On Instagram, this means seeing how reach may have impacted engagement, which content managed to stand out to attract your audience, and how investments in ads influenced interactions, for example.
Additionally, it’s necessary to have a macro view of the project. Let’s suppose that your main goal is to generate 50 business opportunities through RD Station for your client or company every month.
Of course, you will closely follow this metric, lead generation, and all other results from the platform that are associated with your success or failure.
But, for leads and opportunities to be generated, you need to drive people to your client’s website, promote Landing Pages, run ads, among other actions that involve different channels.
So, regardless of whether your goal is achieved or not in a month, it is essential to broaden your view and understand how efforts in each media led to that result to start planning the next steps of the project.
- Focusing Only on the Past and Not the Future
When we start analyzing data from social media, it is normal — and also very important — to emphasize what happened and what made the project reach these results.
However, your interpretation should not stop there. Metrics are an important base not only for understanding the past but also for building the future of each channel.
If a particular action did not result in success on a social network, it does not have to be seen as a problem, because digital marketing is there to allow us to test, fail, recalculate the route, and succeed.
But for this cycle to make sense, it is necessary to use the analyzed data as a basis for new strategies to be applied.
Therefore, in your report or meeting with the client, always leave room to talk about future plans and make your results truly useful to them.
- Not Knowing How to Tell a Story with Your Data
And if data analysis helps to create this relationship between past and future, it means that it also exists to tell the story of your project.
Many marketing professionals, when faced with social media reports, have difficulty moving beyond the technical view that numbers and graphs present and diving into the possibilities of storytelling.
But the truth is that this point is directly linked to what we discussed in the first tip: no social media is worked in isolation, and they all cooperate for a larger marketing objective.
Thus, when developing your report, think about the story you are telling, what is your final purpose, which channels are involved in achieving it, and how each of these “characters” contributed and will contribute to your strategies.
Not sure where to start? We can help: here at Reportei, we developed the Timeline feature precisely to help our clients tell each stage of the story of their projects without complication.
Through the timeline, you can add all the important milestones, complement with observations, videos, images, and everything that helps to create a complete and easy-to-visit history whenever needed. To learn about this feature, click here.
- Failing to Communicate Results to the Client
Thinking now about how data analysis impacts the relationship with clients, it is important to remember that each decision-maker has a different way of absorbing this information and participating in the progress of the project.
While some will have a more technical view, clinging to every detail of each channel, others may be more objective and perhaps not understand so deeply what the metrics mean.
In this way, it is essential that you take advantage of the previous steps (such as having a macro view of the project and telling a story from it) to adapt your analyses to the profiles of the decision-makers.
If the client does not understand much about metrics, it is ideal to explain point by point in the most didactic way possible, focus on what is really important for the project, and open space for them to ask questions and learn from you. On the contrary, if they are more technical and have knowledge about digital marketing, the presentation will need to be deeper, and you must master every detail to involve them at that moment.
By adapting your way of communicating data to each client profile, you will have much more ease in generating trust in your work and developing a partnership relationship.
- Spending More Time on Data Collection Than Analysis
In the last item of our list, we couldn’t overlook the difficulty in data collection and building a report from scratch before starting the analysis.
The truth is many analysts still work with manual data collection, moving from one media to another, taking screenshots to create their presentations, and even structuring dashboards in Excel spreadsheets.
Although it’s a quite traditional method for many agencies and companies, it always demands a significant amount of time, which could be invested in the analysis of the information and the improvement of strategies.
When data collection becomes automated, the team can be more productive in this phase of the process and focus on what really matters: planning effective actions for the client.
The Most Used Data Analysis Tools
In the market, there are various data analysis tools available — each with its own features and specializations.
In many cases, the choice of the right option depends on the specific needs of the project, user preference, and the type of analysis to be performed. Follow along for some examples!
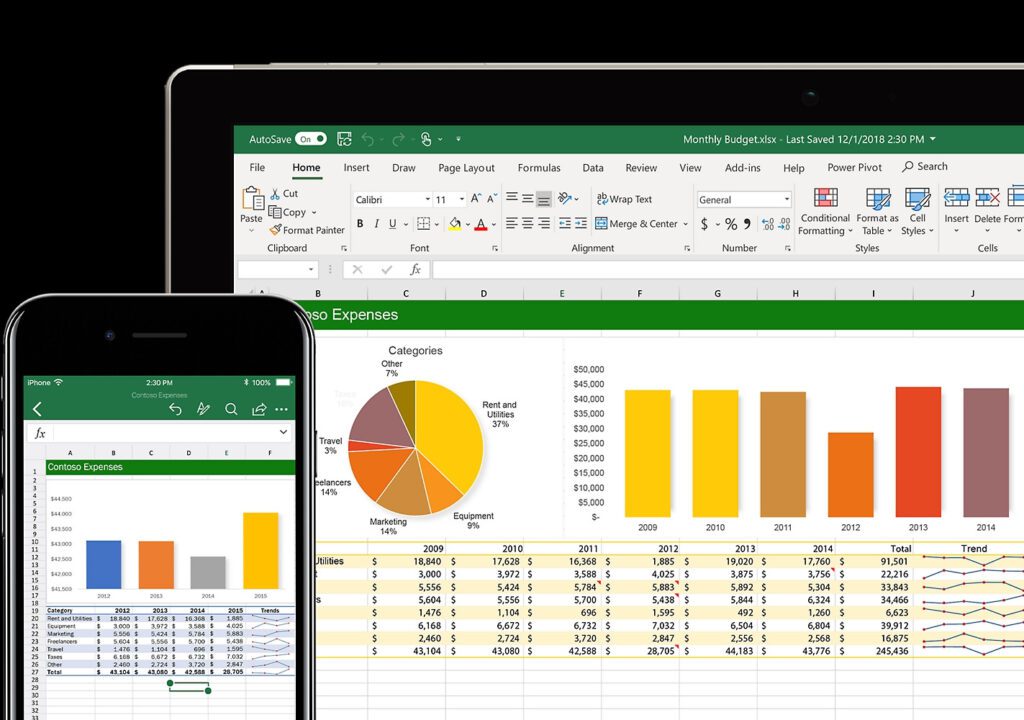
Microsoft Excel
Microsoft Excel is a spreadsheet tool that has become omnipresent in offices and agencies worldwide.
With its familiar interface and robust functionalities, Excel offers powerful resources for data analysis. It allows the creation of pivot tables, charts, and complex formulas, providing flexibility for users of all skill levels.
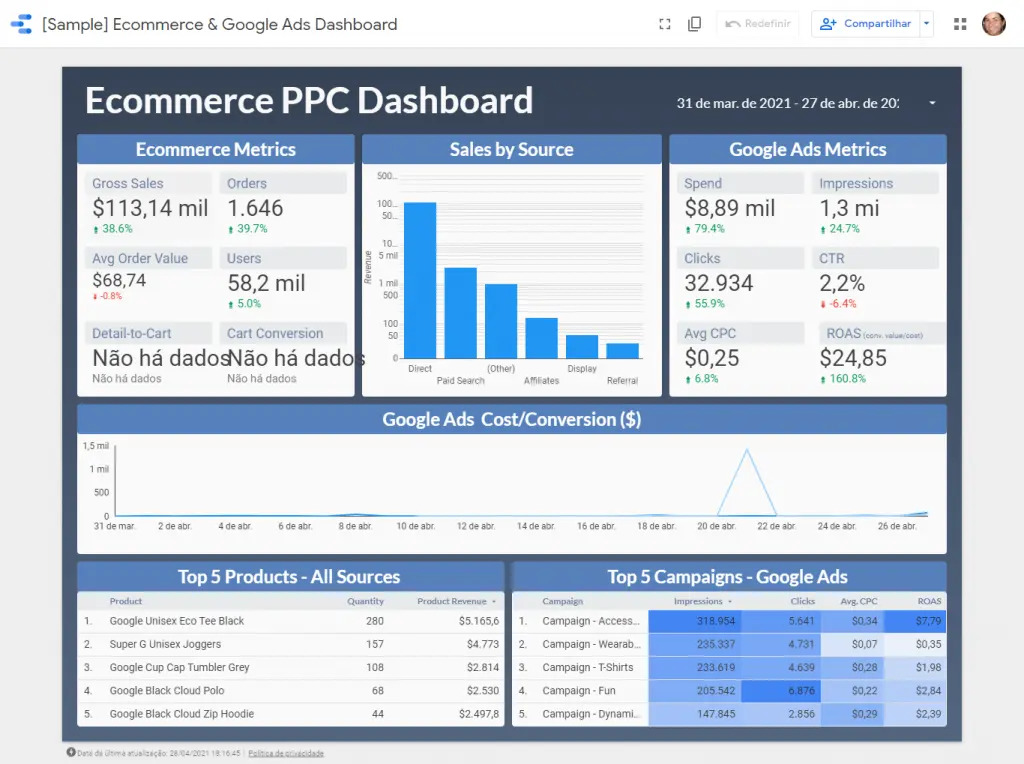
Google Data Studio
Google Data Studio is a data visualization platform that allows you to create interactive and customized reports.
Integrated with Google products, like Google Analytics and Google Sheets, for example, Data Studio simplifies the creation of virtual dashboards.
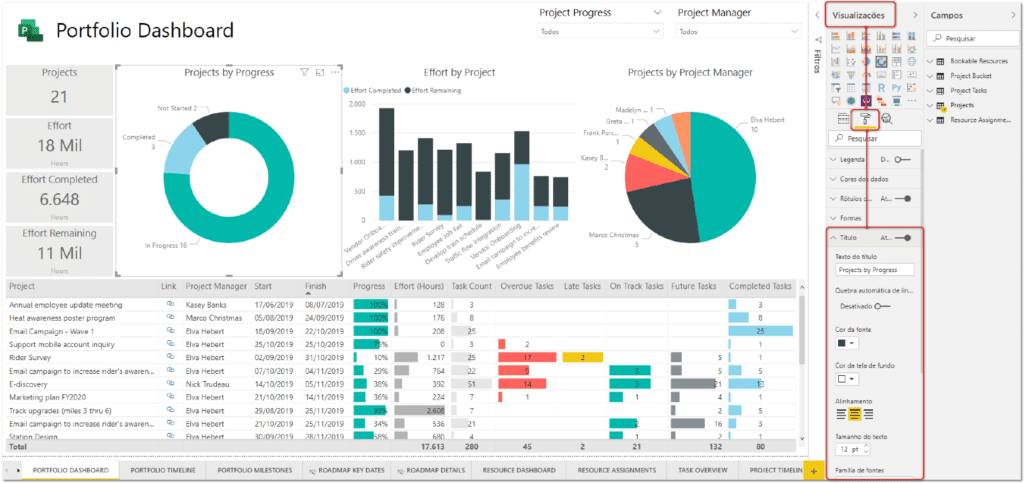
Power BI
Developed by Microsoft, Power BI is a powerful tool for data analysis and information visualization.
With the ability to connect to various data sources, Power BI enables the creation of interactive dashboards and dynamic reports.
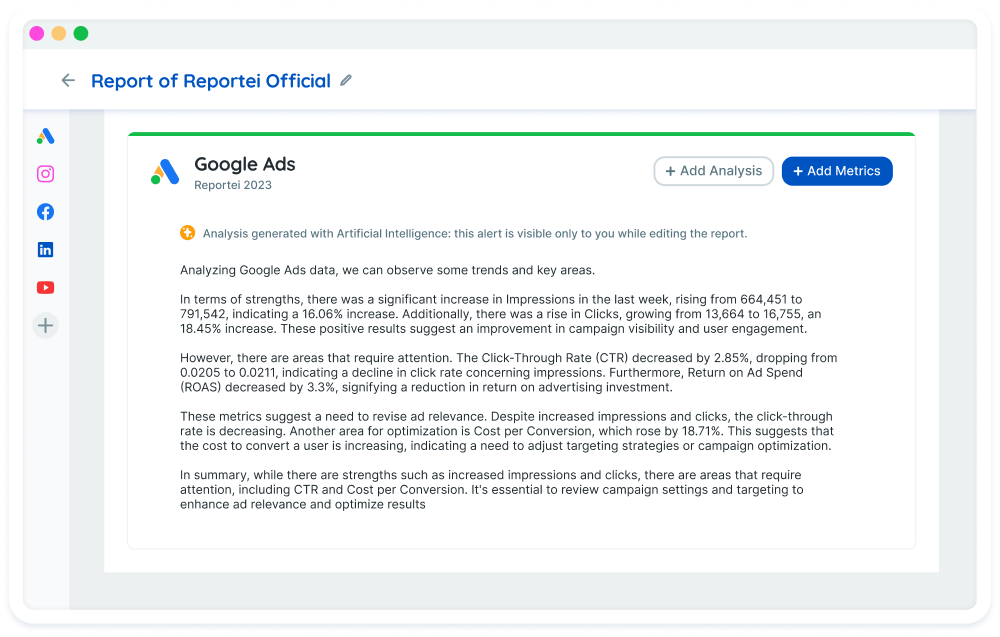
Reportei
Reportei is a platform developed for simplified report and dashboard creation, offering an intuitive interface that allows users to create personalized reports efficiently.
Why Invest in a Digital Marketing Data Analysis Solution?
Investing in these tools is a fundamental step for all businesses seeking to stay competitive in the market.
- Operational efficiency: Specialized tools provide efficiency in collecting, processing, and analyzing large volumes of data, saving time and resources.
- Greater accuracy: Dedicated solutions offer advanced functionalities that increase the accuracy of analyses, resulting in more reliable insights.
- Real-time monitoring: Furthermore, digital marketing data analysis solutions enable real-time metric tracking, allowing immediate adjustments in campaigns to maximize results.
Also read: Why We Believe So Much in a Data-Driven Culture?
How to Generate Results in Marketing with Data Analysis?
The first step to generate results with data analysis is to implement a data culture in the company, through team training, tool integration, and encouragement of curiosity and insight seeking, for example.
From there, it’s possible to put into practice action plans based on the results obtained in each analysis.
- Audience segmentation: Use data analysis to identify more receptive audience segments and then customize strategies to meet different profiles.
- Campaign optimization: Monitor key metrics to assess campaign performance and adjust them in real time to maximize impact.
- Content personalization: Analyze the data to understand customer preferences and tailor marketing content accordingly. Generate results in much more assertive strategies, thereby boosting your brand’s growth.
Here at Reportei, you can generate complete reports in just three seconds for various channels, such as Facebook, Instagram, YouTube, LinkedIn, Google Ads, Google Analytics, RD Station, and many more. Additionally, they are customizable, and you can add analyses, metrics, and create templates whenever you want.
Simply integrate your media and also take advantage of dashboard creation functionalities, report automations, and timeline.
Join Reportei now for your three-day free trial and apply all our data analysis tips in a more practical and effective way!