Find out why the KPI dashboard is essential for your data analysis and how to create an efficient indicator panel.
The ability to make rapid, data-driven decisions is a decisive factor for the success of any company. In this context, the use of visual tools such as the KPI dashboard has become increasingly relevant.
After all, with it, managers and teams can monitor key performance indicators, understand the context in which the results are set, and direct strategic actions with much greater agility.
That’s why, in this article, we will explore the main benefits of the KPI dashboard how to track results more efficiently, and how tools like Reportei can make your marketing and sales analysis routine even simpler and more effective. Check it out.
What is a KPI dashboard
The KPI (Key Performance Indicators) is a visual tool that groups in one place several strategic performance indicators for the business.
These metrics can represent different sectors of the company, such as marketing, sales, finance, human resources, among others.
Together, they offer a consolidated and simplified view of the results allowing managers and teams to track goal progress and make more assertive decisions.
But what differentiates a performance indicator dashboard from a traditional report Simple, the dashboard presents data dynamically, which facilitates the identification of trends, bottlenecks, and opportunities.
In other words, from it, it is possible to track metrics in real-time, analyze specific periods, filter information by channel, product, or campaign, making results management a continuous, precise process integrated into the company’s strategy.
10 benefits of using a KPI dashboard to monitor your results
If you still don’t know why to incorporate the indicators dashboard in your company, don’t worry. Below we list 10 benefits that the tool offers to transform your routine analyses.
Each of these points highlights a crucial aspect to boost the efficiency, growth, and competitiveness of your business. Let’s go.
1 Integrated view of performance
One of the biggest benefits of a KPI dashboard is the integration of information. By gathering data from different areas in one place, such as marketing and sales, managers can have a holistic view of the company’s performance..
This helps to understand how each area relates to the other, providing strategic balance and quicker identification of improvement points.
2 Agility in data analysis
Data-driven decision making is an indispensable step for companies today.
Thus, a good performance indicator dashboard delivers metrics already organized and updated in a way to reduce the time spent on research and consolidation of manual reports. This way, the team gains agility to interpret the numbers and act promptly.
3 Quick identification of bottlenecks
By viewing all relevant metrics in one place, it becomes simpler to detect possible bottlenecks in internal processes.
For example, if a digital marketing campaign is not performing well or a product shows a drop in sales, the dashboard will highlight these problems sooner, allowing course corrections before they affect the results.
4 Transparency in communication with the team
Sharing the indicators dashboard with team members increases transparency.
In other words, everyone gains access to the same data and better understand what the goals, current results, and improvement expectations are. This, of course, encourages collaboration, engagement, and alignment of everyone in pursuit of the same objectives.
5 Access to real-time data
Most dashboards offer automatic metrics updating. This means that instead of relying on monthly or weekly reports, it is possible to access real-time data.
This immediacy increases responsiveness, improves performance, and enhances the business’s competitiveness.
6 Reduction of manual errors
Creating a KPI dashboard in Excel for example, can be a good starting point for those who want to monitor results, but more sophisticated tools connected to automated data sources reduce the need for manual input.
With this, you reduce human errors and ensure more reliability in the information, resulting in safer decisions.
7 Greater precision in strategic planning
Strategic planning relies heavily on data and forecasts. Thus, with a performance indicators dashboard, it is easier to analyze historical data, project future scenarios, and outline realistic goals.
Consequently, greater planning precision translates into better resource utilization and more consistent results.
8 Improvement in decision making
With clear and accessible data, decision making ceases to be based on feeling and becomes founded on evidence.
In other words, by seeing the impact of each action on the dashboard, managers can identify what works and what needs to be reviewed. Indeed, this evidence-based and agile decision-making raises the efficiency and competitiveness of the company.
9 Identification of growth opportunities
Just as the dashboard helps in spotting bottlenecks, it also allows the identification of growth opportunities.
For example, increasing metrics in certain areas may signal markets to be tapped, products with expansion potential, or digital marketing strategies promising. From this data-oriented perspective, the company can be driven to explore new paths..
10 Continuous process optimization
Finally, a KPI dashboard is not just a monitoring tool but a guide for continuous optimization.
In this way, by tracking performance daily, it is possible to implement small improvements consistently, maintaining a cycle of evolution that benefits the business in the long run.
How to create an efficient dashboard with Reportei
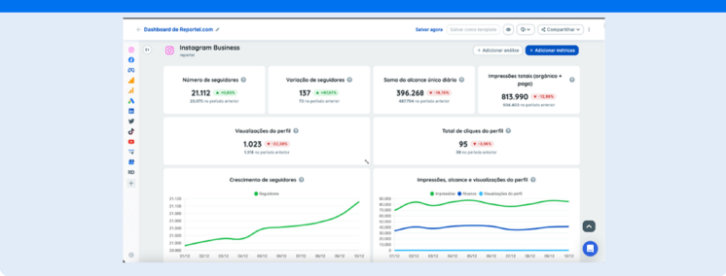
Now that we understand what a KPI dashboard is and its benefits, it’s worth knowing a solution that makes the creation and monitoring of these indicators simpler, Reportei.
Specialized in creating automated reports and dashboards, our platform integrates data from various marketing and sales sources to make your routine analyses much more agile and productive.
But how to make the most of Reportei to create an efficient dashboard? Below we have selected 5 steps to assist with this process.
1 Define your strategic KPIs
Before you start creating your indicator dashboard in Reportei, it is essential to be clear about which metrics are most relevant to your business..
Thus, define the KPIs according to your short, medium, and long-term goals and objectives.
For example, if the goal is to increase online sales, indicators such as conversion rate, ROI, CAC (Customer Acquisition Cost), or cart abandonment rate in the case of ecommerces can be essential.
2 Connect your data sources
Reportei allows you to quickly integrate various data sources such as Meta Ads, Google Ads, Instagram, Google Analytics, LinkedIn Ads, among others.
Thus, you can consolidate all metrics in one place, avoiding the rush of accessing multiple platforms. This integration even speeds up dashboard creation and facilitates the visualization of the business’s overall outlook.
3 Create customized visualizations
One advantage of tools like Reportei is the ease of dashboard customization.
This way, it is possible to choose the types of graphs, tables, and other visual elements that best translate your data. This way, your KPI dashboard will be more intuitive and pleasant to analyze.
4 Constantly monitor results
Regularly monitoring the indicators dashboard is essential to detect fluctuations, problems, or opportunities.
In this case, with Reportei, you can access your reports from anywhere, which allows for a dynamic and real-time analysis. Indeed, this practice ensures that the decision-making process is more agile and assertive.
5 Share with the team and clients
Finally, transparency is a remarkable feature of using dashboards. By sharing your KPI panel with the team or clients, everyone gains access to the same information, which facilitates communication, alignment of expectations, and collaboration..
Moreover, Reportei also offers simplified and customizable panels that can be sent directly to the project’s decision-maker, improving the perceived value of your service.
In other words, by using tools like Reportei, creating and maintaining efficient dashboards becomes even simpler, saving time, reducing errors, and ensuring clear and objective communication with your team and clients.
Take advantage of our free trial period and see in practice how our platform can assist in building your KPI dashboards and conducting more strategic analysis.