Here’s why Retention of Instagram Stories affects your results
The retention metric of Instagram Stories is essential if you want to understand how viewers engage with your content. However, many people question how retention works and how it’s calculated for Reportei reports.
The truth is that the retention metric plays an important role in your results. Our team developed it to provide clients with the most information possible regarding their Instagram actions.
If you’d like to know everything about the retention metric of Instagram Stories and how you can best use it to improve your content, you’re in the right place. Keep reading to check it out!

What does the Retention Metric of Instagram Stories mean, after all?
Simply put, the Retention Metric of Instagram Stories is a means of understanding what percentage of your viewers watch your Instagram stories until the last segment.
Viewers can do a lot while watching (such as exiting, moving to the next or previous segment, and jumping to another account’s stories). So, we did some research to find the perfect formula for measuring viewership retention of stories.
Here is the equation we found to calculate it. Subtract the number of exits from the number of viewers reached and then divide the difference by viewer reach.
That means if you have reached 100 viewers and 15 of them exited your stories, the equation looks like this:
100 (reach) – 15 (exits) = 85 (difference)
85 (difference) / 100 (reach) = 0,85, which is 85% (retention rate)
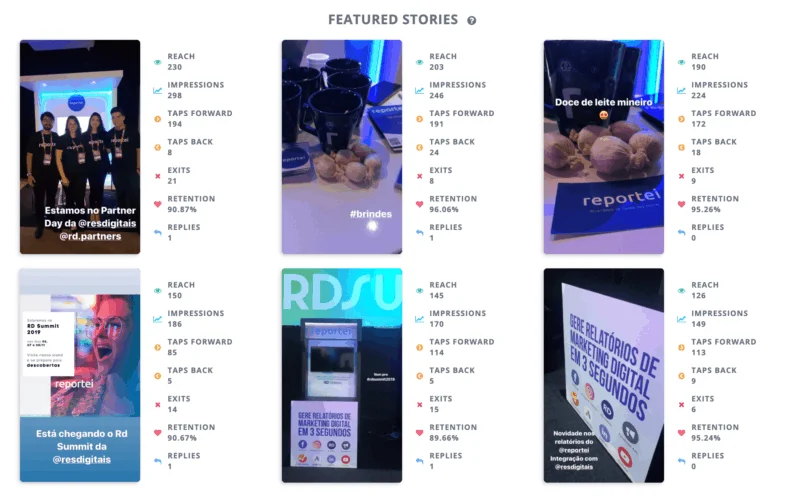
As the result is calculated individually next to each featured story, it becomes invaluable to understanding what content gets higher retention.
This helps you determine what works for your audience and what doesn’t, so you can plan future Instagram strategies more efficiently.
It’s important to note that we can only consider an exit when the viewer swipes to another profile’s story or leaves Instagram stories altogether and returns to his feed.
If the viewer taps to jump to the next segment, but continues watching your profile’s story, that’s retention.
Want to understand the retention metric of Instagram Stories more fully? Check out this video by Rodrigo Ferreira Nunes, our CTO.
What other Metrics does the Instagram Stories Report include?
Besides the Instagram Stories Retention Metric, there is more essential data that you should analyze to get a fuller picture of your results, which is:
- reach: number of individual profiles that viewed a story during the 24 hoursit was available;
- impressions:number of times a viewer watched a story, even if the same profile viewed it more than once;
- taps forward:number of times a viewer tapped to jump to the next segment of a story;
- taps backward: number of times a viewer returned to the previous photo or video of a story;
- exits: number of viewers who “abandoned” the story. As we said before, this is when a viewer jumps to another account’s story or goes back to his feed;
- replies:number of viewer replies that a story received
The metrics above are assessed individually for each of the six featured stories. These are chosen according to best reach performance
How to generate the Instagram Stories report?
While generating an Instagram Stories report is very simple, it requires a bit more attention than the other social media you can analyze with our tool.
That is because story-related data only lasts as long as your story content remains available. Different from Facebook, for example, which can retrieve data as far back as two years.
That means you won’t be able to save the data of your Instagram Story report if your account is not active on Reportei.
In other words, you will need to register and integrate your client’s Instagram account well before you start generating reports and gauging results, got it?
Once you’ve done that, all you have to do is follow the steps for generating other social media reports. Import your data automatically in three seconds, create your customized template, and add your insight on events through open-analyses.
So, what do you think? Did you like finding out about the retention metric of Instagram Stories? This metric makes it so much easier to understand why your content is and can become more attractive to viewers, right?
Now that you know all about Instagram Stories on Reportei, all you have to do is access your account and try out its features!


