Learn which metrics to analyze on Google Analytics 4 for guaranteed success of your website or app
As the end of Universal GA draws near, marketers are getting ready to make the permanent switch to GA4. But it’s not only the platform’s framework that’s changed. Have you heard of GA4’s new metrics?
Now, data follows the sales funnel logic to help you more effectively analyze the purchase journey on your website or app.
Learn about the top 10 key Analytics 4 metrics in this article, and find out what has and hasn’t changed. Here’s what you can find in the new reports and how to extract valuable insights for your business or clients. Check it out!
How do Google Analytics’ new reports work?
Google Analytics 4 is here with some major changes to report models, including website and app performance data.
In a nutshell, the main goal is to more fully integrate customer channels and give you a comprehensive view of traffic, user engagement, and (of course!) the financial return of campaigns.
In order to do that, GA4’s strategic reports are packed with insight and organized in the 4 stages of the Customer Lifestyle:
- Acquisition: focused on attracting users to websites and increasing traffic;
- Engagement: data on user/page interaction events (views, conversions, and others);
- Monetization: detailed sales and revenue data from e-commerces or apps, including advertising investments;
- Retention: the number of users returning to your channels, giving you a fuller understanding of the retention process with user lifetime value (LTV).
All that helps you analyze your strategies, making them more efficient and fine-tuned to the customer journey.
10 metrics to analyze in Google Analytics 4
“Which GA4 metrics does the Lifecycle report include?” you might ask.
First, it’s worth noting that each report comes with a wide range of metrics to help you understand user behavior and activity on your website or app.
However, some metrics stand out when analyzing acquisition, engagement, monetization, and retention. These are the top 10 to watch:
1. Total Users and New Users
These two metrics have been continued from Universal Analytics and are included in GA4’s acquisition reports to a similar end:
- Total Users: unique visitors to your channel within a specified period;
- New users: first-time site visitors.
Demographic Information and Technology gives you an understanding of who visitors are and what devices they use to access and interact with your site.
2. Sessions
Though they’ve kept their original name, GA4 sessions are measured differently, which might raise a few questions for marketing analysts.
That’s because this metric’s data is now extracted from an event (session_start), and sessions begin automatically when visitors:
- Open your app in the foreground;
- Or view a page on your site (with no currently active sessions).
3. Engaged sessions
And it’s not only sessions that are measured differently. Google Analytics 4 also has metrics for Engaged Sessions, meaning hits on your site that lead to event activity.
This metric displays the number of sessions lasting over 10 seconds that either generated conversions or included two or more page/screen views.
You can also track engaged sessions per user, viewing the number of visits where users interacted.
4. Engagement rate
The relation between engaged sessions and sessions brings up another important metric: the engagement rate of your website or app.
It’s a percentage value that helps you gauge how much user interaction your channels encourage and retain on your pages.
Then, you can plan strategies to improve your content, increase conversions, or attract visitors to other pages or screens.
5. Average engagement time
Along with your website or app interaction rate, tracking the average engagement time is a must. It shows how much time visitors spend on specific activities during their visits to your channel.
With these metrics, you can find out what attracts and encourages engagement on your pages.
6. Event count
Interaction is directly related to events. The Engagement tab details activities according to pe-defined settings (page views, scrolls, clicks to exit, and searches) or custom settings.
The report includes event count metrics with the number of actions and events per user.
7. Conversions
The Engagement tab also includes conversions through the channel, with the number of times a conversion event was triggered.
For accurate results from that data, you’ll need to set up this activity in GA4. Access the platform’s Settings, and then select the Conversions tab.
8. Revenue
Let’s move on to the monetization report, where you can closely monitor the total revenue of your website, whether from e-commerce, in-app purchases, or return on your advertising investments.
9. User retention
Of course, far more than selling, you want to retain site visitors and encourage them to keep consuming your content or products.
To this end, one key Google Analytics 4 metric is the retention percentage of new users. It gives you insight into how many of these users visit your channel daily.
10. Lifetime value
Finally, the retention report includes the lifetime value metric, so you can understand the continuity of user activity in your app.
GA4 calculates Customer Lifetime Value (LTV) from summing up AdMob purchases and earning events on your app within the first 120 days of use.
How can I analyze Google Analytics 4 metrics more efficiently?
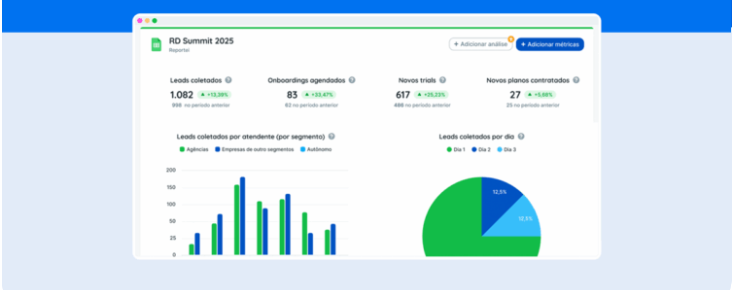
Now that you know about Google Analytics 4 reports and top 10 metrics, we have some more great news! You can capture all that data quickly and smoothly using Reportei!
You can integrate our platform with GA4 to generate full reports with your website or app data on attraction, engagement, monetization, and retention in a couple of seconds.
Plus, you can access info on your traffic sources with an in-depth understanding of visitor behavior on your channel.
Start your three-day free trial now and watch Reportei help change how you analyze metrics on Google Analytics 4.