Learn what an online dashboard is, the benefits it offers for marketing analysis, and how to differentiate it from static reports.
In an increasingly competitive environment, marketing and data managers need solutions that allow them to analyze results in real time and make decisions quickly. In this context, the online dashboard stands out as an indispensable tool.
After all, it gathers strategic indicators of campaigns, sales, and other initiatives in a single dynamic panel.
This makes it easier to identify trends, correct routes, and keep the entire team aligned with business objectives without the need to deal repeatedly with extensive reports or data dispersed across multiple platforms.
Therefore, in this article, we will explain in detail how the dashboard can benefit your daily operations, which metrics should be monitored on the panel, and how Reportei can help on this journey. Let’s go!
What is an online digital marketing and sales dashboard?
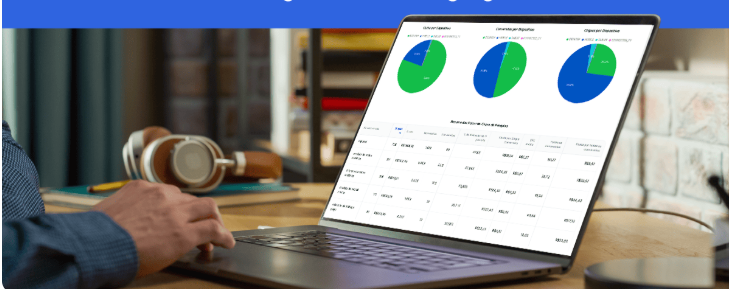
An online dashboard of digital marketing and sales is simply a tool that consolidates, organizes, and displays strategic data from different sources in a single panel.
In other words, unlike complex spreadsheets or extensive reports, this dynamic panel presents information in real time and visually, which facilitates quick interpretation and decision-making.
For marketing managers and analysts, for example, the dashboard is essential for tracking campaign performance, leads generated, social media engagement, and sales conversion rate, among other indicators.
Thus, when choosing to create an online model, this information can be accessed from anywhere, which promotes agility and facilitates collaboration between different teams.
Therefore, instead of scouring different platforms and report formats, the team can focus on interpreting the most relevant information and quickly understanding what works and what needs to be adjusted.
Difference between a marketing report and dashboard
It is often normal for there to be confusion between the use of reports and dashboards.
Although both deal with data and analysis, their purposes and characteristics are distinct and complementary.
That said, the reports:
- Provide more detailed analyses, historical data, and in-depth context.
- Usually offer a static view of data for a specific period, allowing studies of past trends and longer analyses.
- They function as a formal document that records what has been done and are used to present consolidated results to the team, clients, or top management.
On the other hand, the dashboards:
- Present visual and dynamic indicators that facilitate quick decision-making.
- They operate in real time, which makes them ideal for tracking metrics while the process is still ongoing.
- They focus on providing an immediate and simpler view of what is happening at the moment.
In this way, as Rodrigo Nunes, CTO of Reportei, says,
The report sets the future direction while the dashboard is the steering wheel that guides in that direction.
In other words, while the first identifies and records results and future goals, the second serves as a dynamic guide to keep your team on the right track every day.
Thus, both tools complement each other and are essential for any marketing and sales strategy to be based on concrete data.
How an online dashboard facilitates data analysis and accelerates decision-making
Undoubtedly, the great differentiator of creating an online dashboard is the ability to analyze data in real time.
This means that as your campaigns and sales evolve, the panel updates, offering the latest metrics view with every access.
See below what benefits can be extracted from this.
1. Dynamic and intuitive visualization
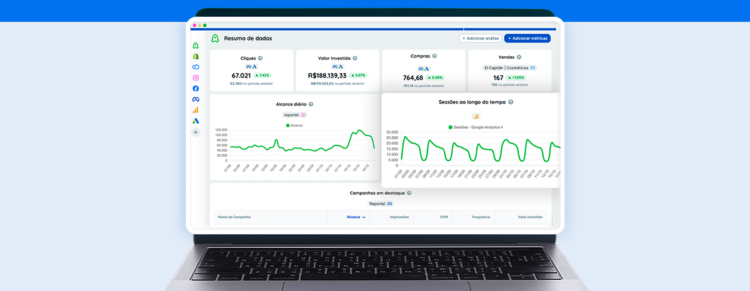
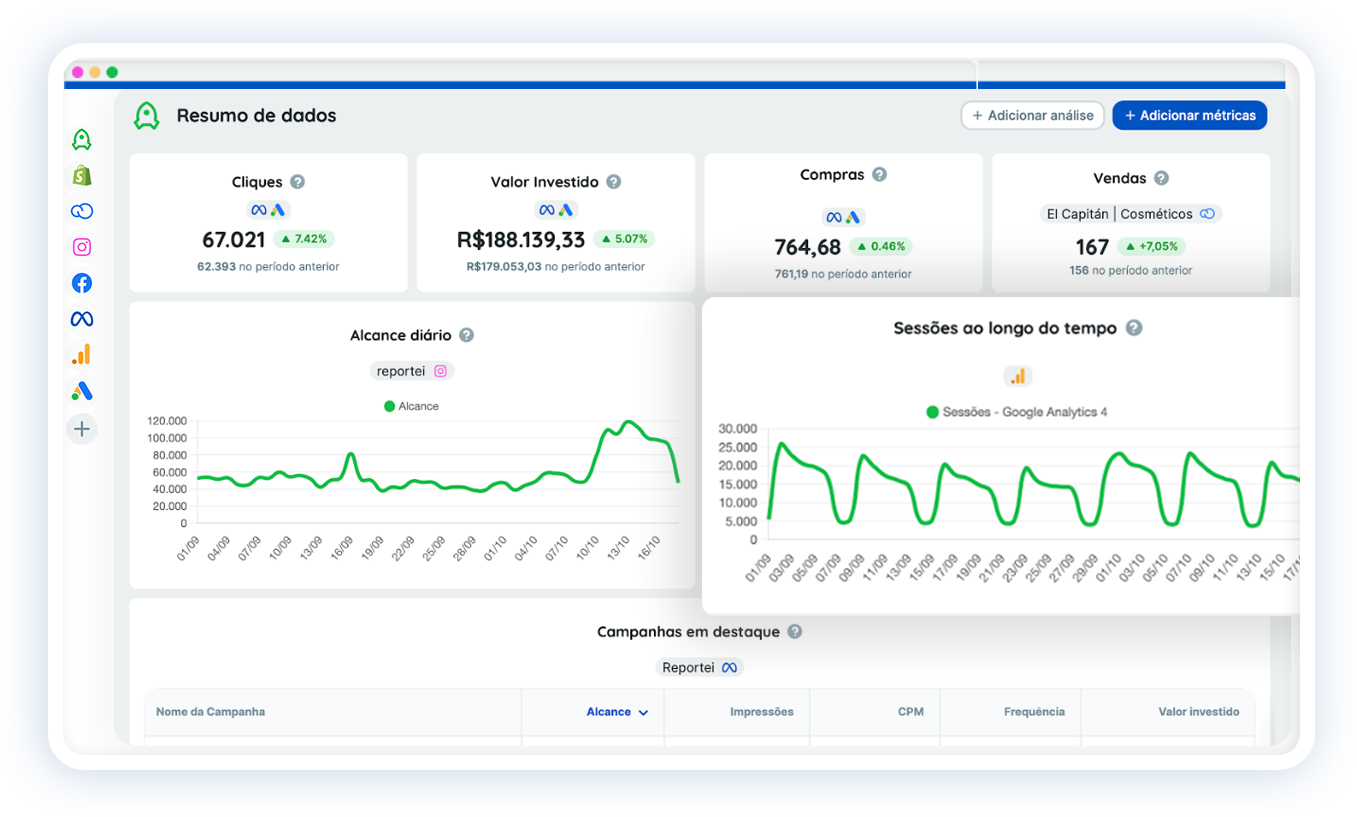
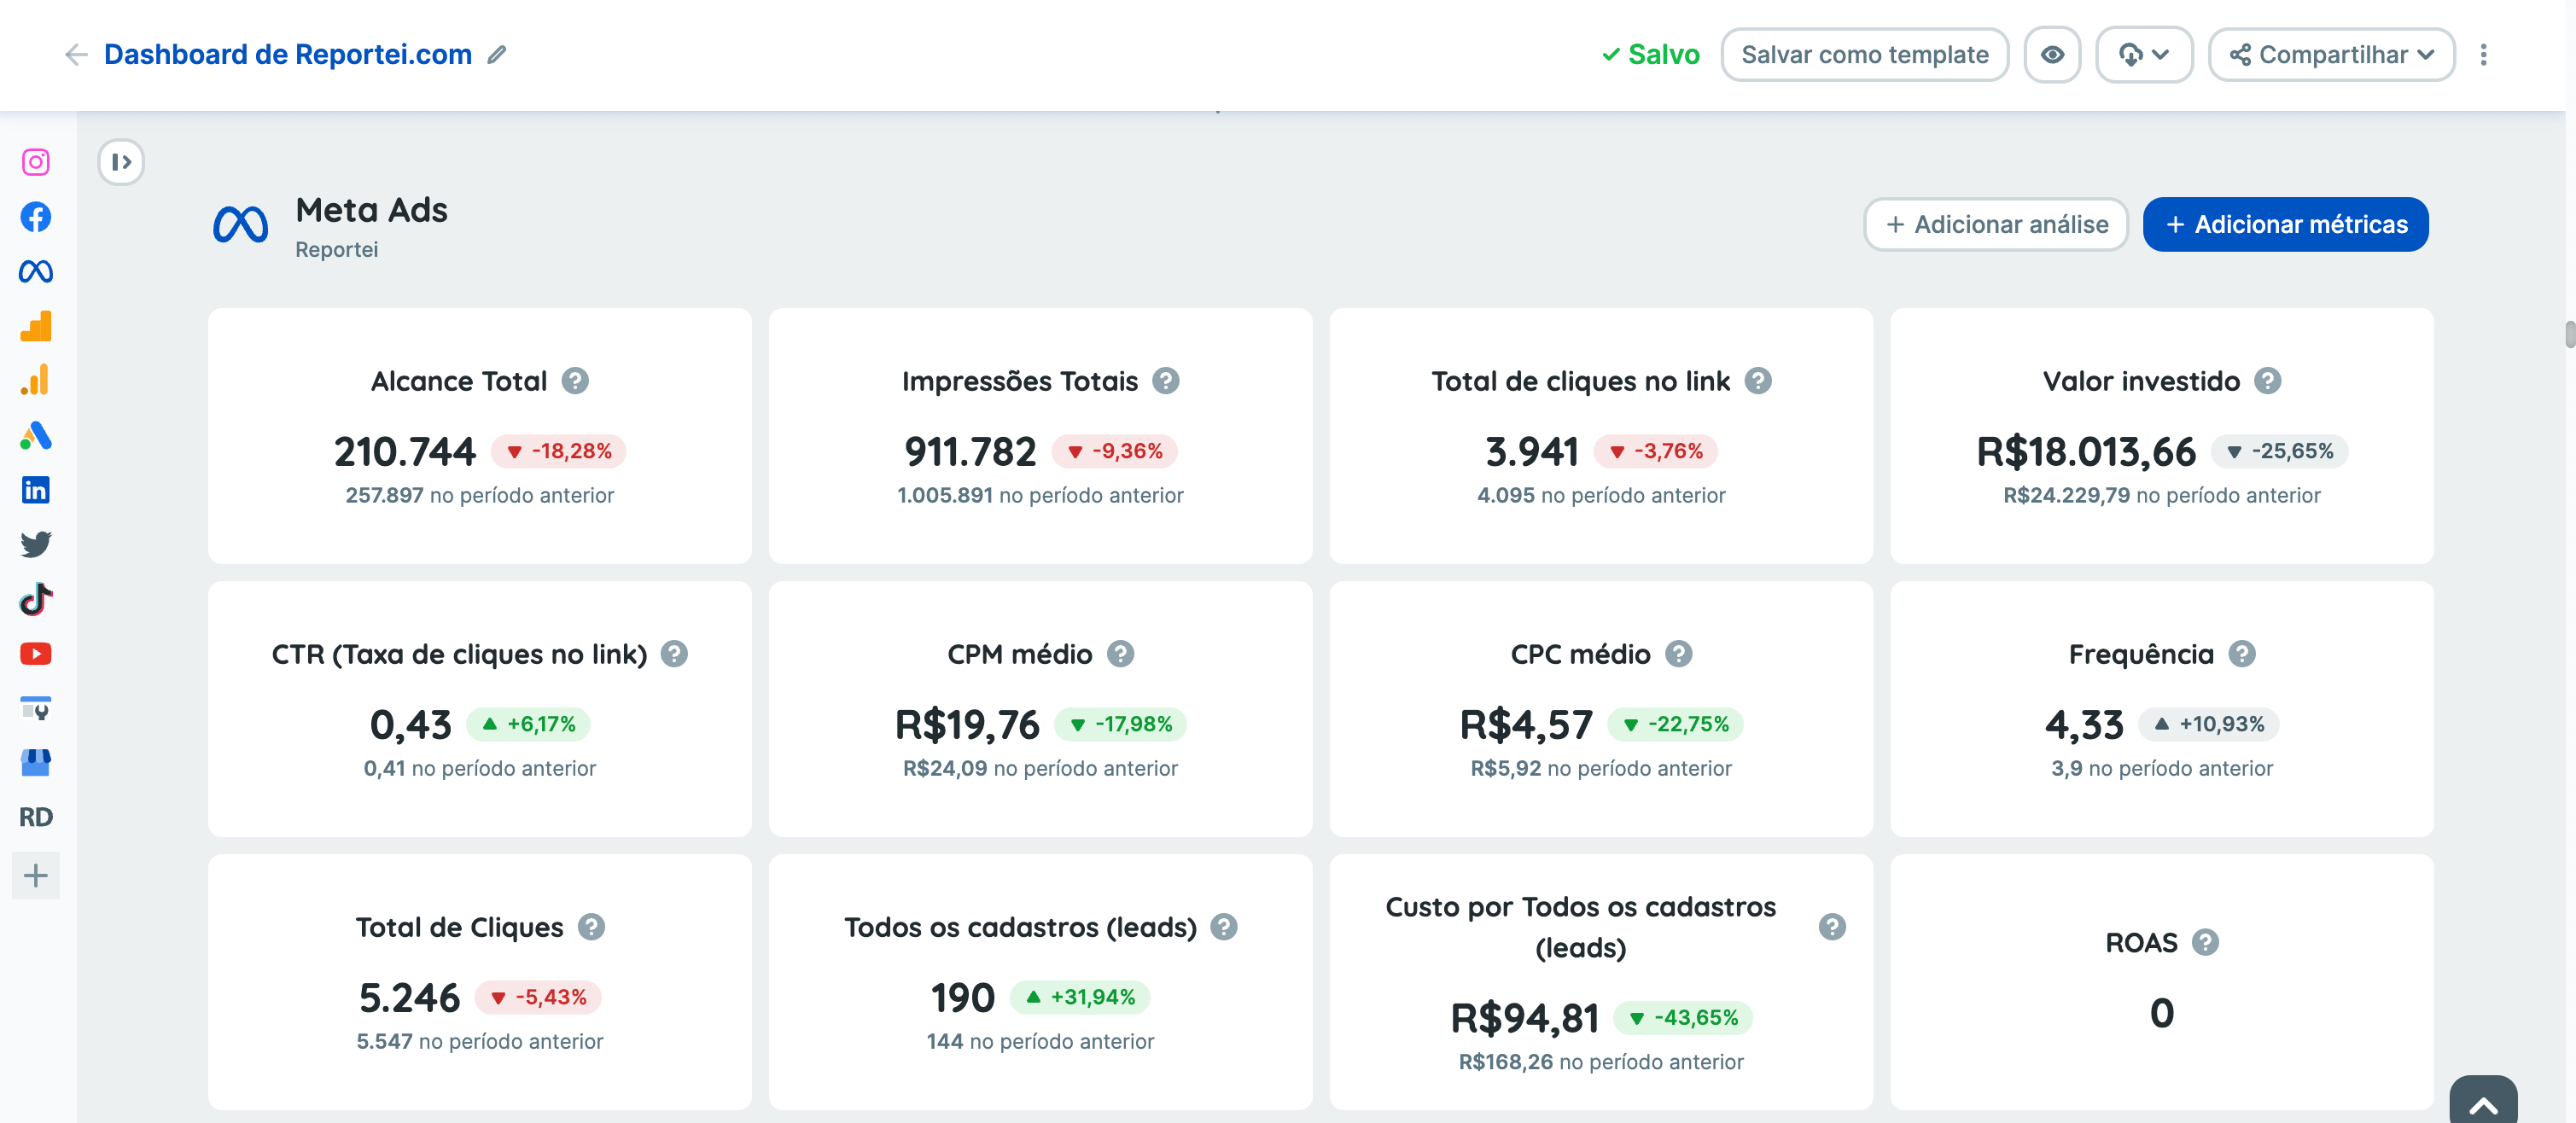
A dashboard typically provides charts, tables, and indicators that translate numbers into insights.
In this way, there is no need to open multiple different sources or perform manual calculations to understand the performance.
2. Centralized access to data from multiple platforms
Digital marketing tools, social networks, email platforms, CRM software, and many other channels can be unified in a single panel.
This eliminates the need to switch between several systems and minimizes the risk of loss or duplicated information.
3. Immediate identification of trends and issues
Through visual indicators, it is possible to detect peaks of engagement or drops in campaigns almost instantly.
With this quick identification, there is the possibility to make immediate adjustments, save time and enhance results.
4. Greater integration between teams
From a single online information source, different sectors like marketing, sales, finance, among others, can align strategies more easily.
That is, everyone accesses the same panel, interprets the same data, and discusses solutions together.
5. Faster decision making
Finally, one of the factors that most impacts a campaign’s success is the agility to correct routes and seize opportunities.
With the dashboard, this speed is maximized as you only need to track metrics in real time and intervene when necessary.
Which metrics are essential for the marketing and sales dashboard
However, to succeed with the online dashboard, it is crucial to know how to choose the metrics that will be analyzed regularly.
After all, selecting too many irrelevant metrics can create noise and hinder the process. On the other hand, failing to include important indicators can also harm the project’s visibility.
Thus, we have selected some of the KPIs (Key Performance Indicators) most important for dashboards that can help build yours. Follow along.
- Conversion rate indicates the percentage of visitors or leads who performed the desired action (form filling, purchase, registration, etc.). It is a key indicator to know if the lead attraction and nurturing strategy is working.
- Number of leads and opportunities generated is essential to track whether the top of the funnel (lead acquisition) and the middle of the funnel (transforming leads into opportunities) are growing properly.
- Cost per Acquisition (CPA) or Cost per Lead (CPL) shows how much was invested to acquire each lead or client. It is essential to measure the financial return of the campaign and understand if the investment is paying off.
- Return on Investment (ROI) measures the profit obtained in relation to the amount invested in marketing and sales actions. A clear analysis of ROI helps prioritize more profitable strategies.
- Social media engagement metrics like likes, comments, shares, and clicks on post links help evaluate campaign performance and how much the audience is interacting with the brand.
- Open rate and clicks in email marketing if the company uses email marketing as an acquisition and relationship channel, tracking these two metrics is vital to identify what works best.
- Sales volume and average ticket to monitor the final result of operations, the analysis of sales and the average value of each sale highlights the campaigns’ performance in terms of revenue.
These are just some of the metrics that, when presented in an online marketing dashboard, provide the team with a clear view of what is happening and allow comparing expected results with actual results.
This makes decisions faster and based on reliable numbers.
How to use the online dashboard from Reportei
Finally, Reportei is a tool that exemplifies well how to create an online dashboard with a focus on simplicity and efficiency. See how it can help in your analyses.
1. Consolidation of data from various sources
As it allows integrating social networks, ad platforms, email marketing tools, websites, and even CRM systems in one place,
This enables a holistic view of campaign performance and helps identify patterns among different data sources.
2. Real-time data visualization
The tool automatically updates indicators, allowing the team to track metric evolution in real-time.
This swift update helps identify opportunities or possible issues quickly, ensuring that the team can act before the situation becomes critical.
3. Customization and segmentation
Each team or member can have a customized panel showing only the metrics relevant to their area.
For example, the social media team can focus on engagement while the sales sector observes the number of new leads and conversion rates.
4. Simplicity in creation and interpretation
Furthermore, the proposal of the Reportei dashboard is not to bring complexity but to make life easier for those who need to make quick decisions.
Therefore, the tool prioritizes intuitiveness and clarity, bringing simple graphs that help understand the scenario without needing to complicate the process. Check below how it works in practice.
5. Ease of sharing
Once the dashboards are set up, it’s possible to share access with clients, colleagues, or other teams.
This transparency enriches collaboration as everyone works with the same data and can discuss route adjustments based on consolidated information.
6 Complement to traditional reports
As we emphasized earlier, the detailed report remains important for defining long-term strategies, analyzing historical results, and formally recording information.
Meanwhile, the dashboard functions as a daily navigation guide and helps maintain focus on the most critical indicators for the operation’s success.
Thus, within Reportei you will have access to the best of both worlds, in order to obtain more complete analyses and maintain efficiency in all scenarios.
What are you waiting for? Take advantage and request a free three-day trial right now to see how these tools work in practice.