We’ve just added a new feature to Reportei: here’s everything about our Pinterest and Pinterest Ads reports
We keep the integrations coming on Reportei! You can now use our reports for Pinterest and Pinterest Ads to analyze your social network strategies more efficiently.
Pinterest is a globally successful social network that aims to help users find and share visual inspiration (fashion, decor, recipes, and more). Over 46 million Brazilians are active on the platform currently.
You can also run ads through Pinterest Ads with its distinct segments, sales-oriented campaigns, and tools to help brands reach their audiences.
If Pinterest is part of your client or company’s strategies, knowing how to generate Pinterest reports quickly and gain insights is fundamental. Keep reading and get the details!
Here’s everything you need to know about our Pinterest reports
Pinterest holds a world of potential for digital marketing companies! It helps create visual and inspirational content to reach the right audience.
But like other social networks, it’s fundamental to monitor the results of your strategies closely! By analyzing metrics, you can gain valuable insights and new ideas to help you effectively increase the engagement of the profiles you manage.
That’s why we couldn’t leave out Pinterest reports on Reportei, a new integration available for all plans. You can have metrics, graphs, and highlights for any specified period at your fingertips with a couple of easy clicks.
Here’s what you can find on Reportei and how we can help you optimize your Pinterest strategies!
Available metrics
Once you integrate a Pinterest account with Reportei, you can create new reports in seconds. Here are the reach and engagement metrics you can monitor:
- Number of Pins: Pins (markers for saving images, videos, or products) you created in a set period;
- Total Pins: total number of posted Pins;
- Impressions: Number of times users viewed pins;
- Engagement: user interaction with Pins (like clicks and saves);
- Engagement rate: interactions related to impressions;
- Total saved Pins: number of times users saved your Pins (repins);
- Total clicks on Pins;
- Click Rate: total number of clicks on Pins related to impressions;
- Total number of boards: the number of boards created in a set period.
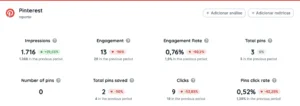
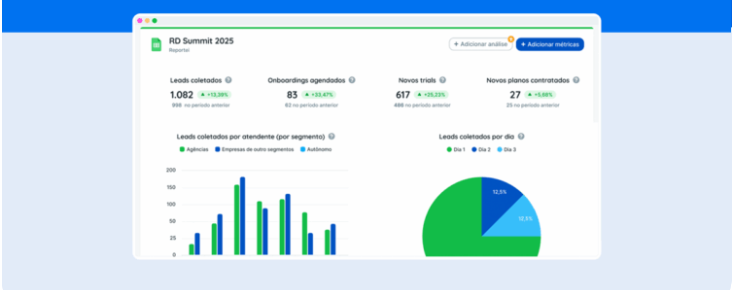
In the first part of the Pinterest report, you’ll find an overview of your account and insights into reach and engagement performance. You can compare periods at any time.
If there’s any data you feel is missing, you can insert it manually to keep a complete record in one place.
And that’s not all! You can monitor results and high-performing Pins in-depth, as you’ll see below.
Engagement graphs and tables
Our Pinterest reports have four graphs to help you analyze your reach and engagement in depth:
- Impressions and engagement over time;
- Clicks and saved Pins over time;
- Impressions by type (product, pattern, idea, and video);
- Engagement by type.
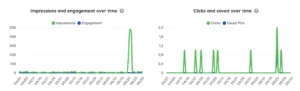
You can track these, analyzing days of the month with the highest performance and comparing interaction types and content formats.
The tables section will show you Featured Pins with the results of your main published Pins for a specified period, and Featured Boards, showing you boards with the highest engagement.
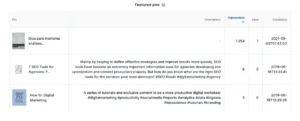
That helps you gauge the kind of content your audience is most attracted to and what formats will help you optimize your profile.
Check out our Pinterest Ads report
Think that’s all? It’s not! Our Pinterest Ads reports are also available to break down campaign performance.
Pinterest’s advertising platform has been available since 2021, with several campaign options for each sales funnel stage. You can focus on awareness, evaluation, conversion, and offline sales.
But efficient strategies require in-depth analysis of what works and what doesn’t, right? That’s why Reportei will automatically capture the most relevant performance data from the Pinterest Analytics tool. Check it out below!
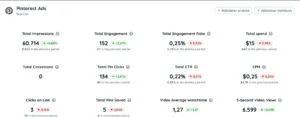
Ads performance metrics
For your Pinterest Ads report, you can access the following account performance metrics:
- Total Pin Clicks – access to content on Pinterest or off it;
- Total saved Pins;
- Number of Conversions;
- Total cost
- Cost per thousand impressions (CPM);
- Click Through Rate (CTR);
- Total engagement with Published Pins;
- Paid Engagement – including saves, pin clicks, exit clicks, and carousel swipes;
- Total impressions;
- Paid Impressions.
There are also graphs comparing clicks and saved Pins over a specified period and Featured Campaigns tables with data on your campaign engagement.
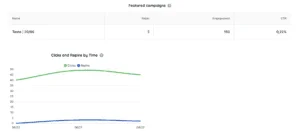
That helps you understand the financial return of your Ads account and which campaigns have a higher chance of resonating with your audience and increasing engagement.
Did you like reading about our Pinterest and Pinterest Ads reports? Then log in or sign up to try our handy new feature now!