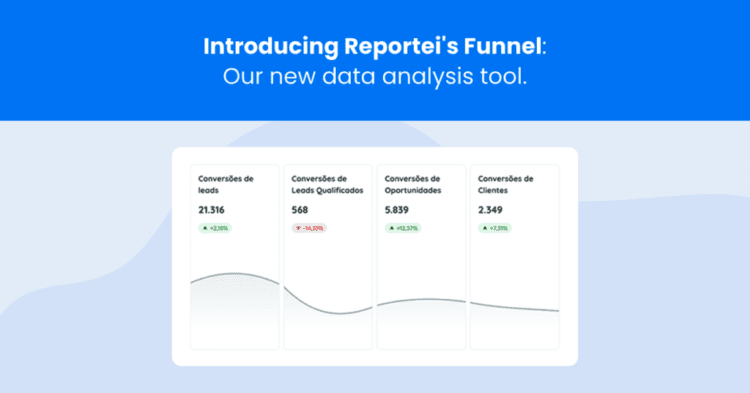
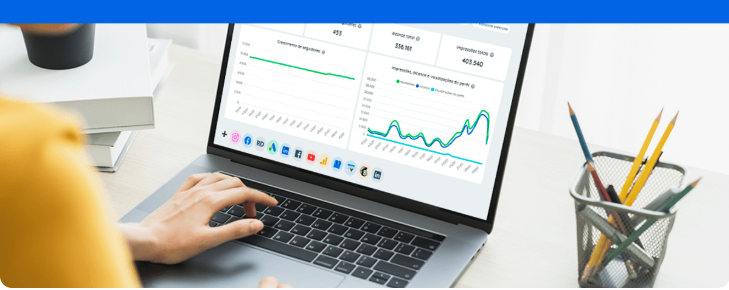
The sales funnel feature has arrived in Reportei reports to assist in providing a clearer and more strategic view of project results. Find out how it works!
One of the most anticipated features by our clients, the Reportei Marketing Funnel is the new data visualization feature in reports and dashboards that helps illustrate how the most relevant indicators from each channel impact the main goal of the project.
Available across all plans and integrations, this functionality enhances interpretation both on the analysts’ side and the clients’ side, aiding not only in identifying areas for improvement but also in extracting insights for more efficient results.
In this article, we outline all the details about this new feature and offer tips on how to apply it to various types of projects, such as inbound marketing, paid traffic, e-commerce, and social media. Stay tuned!
What is the new Reportei Funnel?
Announced as one of Reportei’s new features for 2023, the Reportei Marketing Funnel is a chart that can be built and customized according to the project’s objective, showing how each indicator leads to the final result.
In other words, it’s possible to visualize the process in an integrated manner, which makes it easier to understand how a given strategy “x” led to outcome “y”, identify stages requiring attention, and plan for enhancing marketing ROI.
For example, you can develop a classic sales funnel for an inbound project, displaying the process from lead acquisition to final sales at the end of the journey:
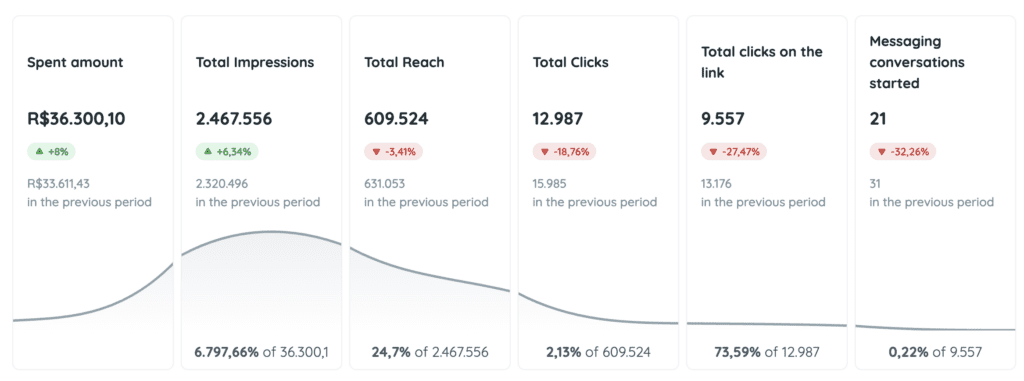
But beyond that, the funnel with results can be used in all available Reportei integrations, such as paid media channels, social networks, analytics, and marketing automation platforms.
Thus, there is the opportunity to prove the value of the client’s investment, highlight the relationship between reach and engagement on social networks, as well as demonstrate the efficiency of digital actions in generating sales.
Up next, you’ll find out how to create your funnels in Reportei and see application examples according to projects. Shall we proceed?
How to Create a Marketing Funnel in Reportei?
Creating a Marketing Funnel in Reportei is very straightforward! When generating your report or dashboard, simply click on “add metrics” and follow the step-by-step process below
- Select the “Funnel” option from the list of manual metrics.
- In the metric settings, define the title and description of what the funnel represents.
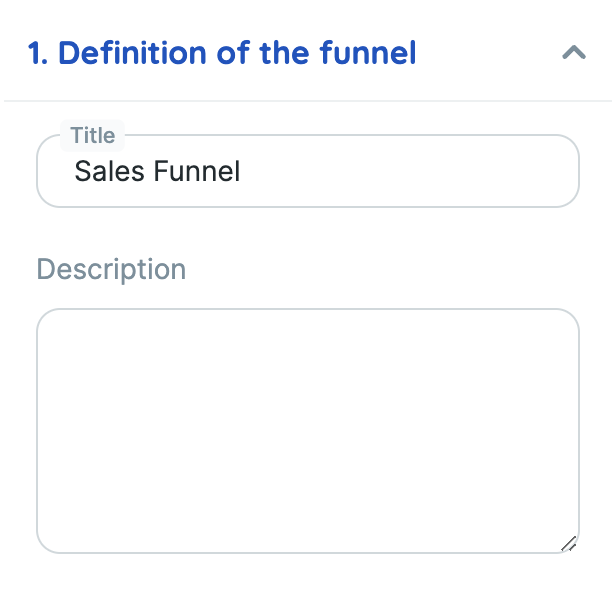
Create the steps that will be part of your funnel – it can be a pre-defined metric or manual one –, select if you want a comparison value and what will be, and if you desire the conversion rate between the steps;
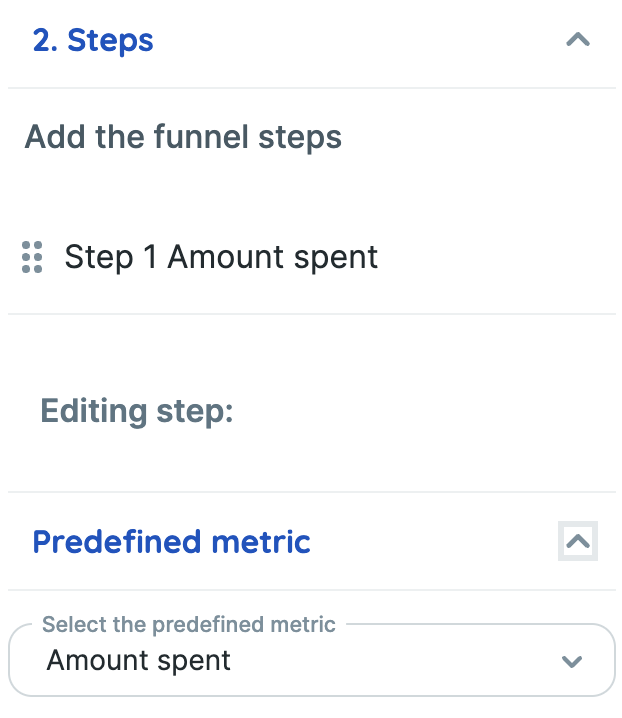
Finally, click on “Save” and access the complete funnel in your report or dashboard.
Tips for Using the Marketing Funnel
Now that you know the step-by-step process to create your Reportei Funnel, it’s worth checking out some tips on how to apply it to reports across different marketing channels and objectives:
Inbound Projects
In addition to the example we showed above of the traditional sales funnel, you can use this feature to illustrate other results of your inbound actions, such as email marketing campaigns.
This way, it’s easier to visualize how content impacts your audience, can be improved to keep the relationship alive with leads, and encourages them to continue on the path to becoming customers.
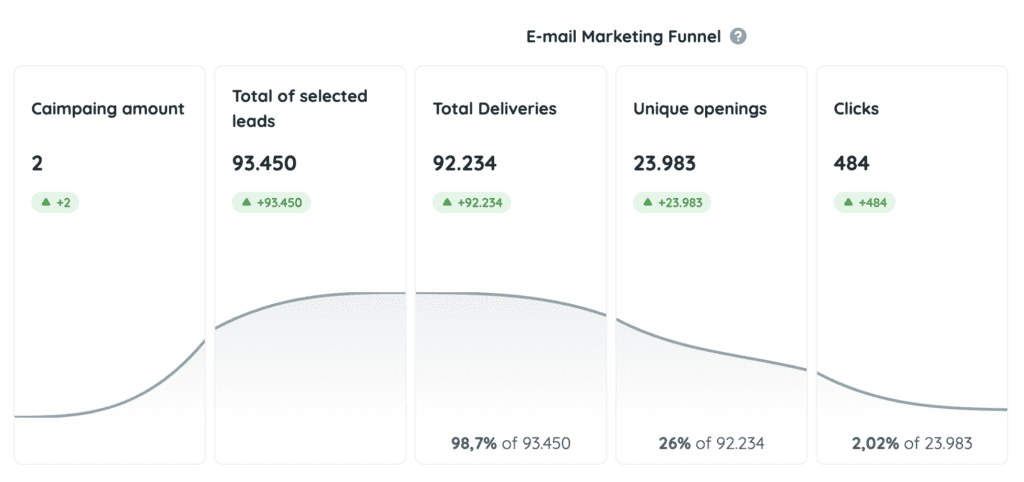
Another interesting possibility is to use the funnel in projects involving CRM management to understand how the stages of approaching opportunities work and what can be done to make the sales process more efficient.
Paid Traffic
As for funnels for paid traffic channels, they are ideal for proving the value of the financial investment to the client, showing everything from the budget applied to the amount of conversions generated by the campaigns developed over the period.
In other words, it’s an essential feature for those working with advertising on Google, Meta, TikTok, Twitter, and much more!
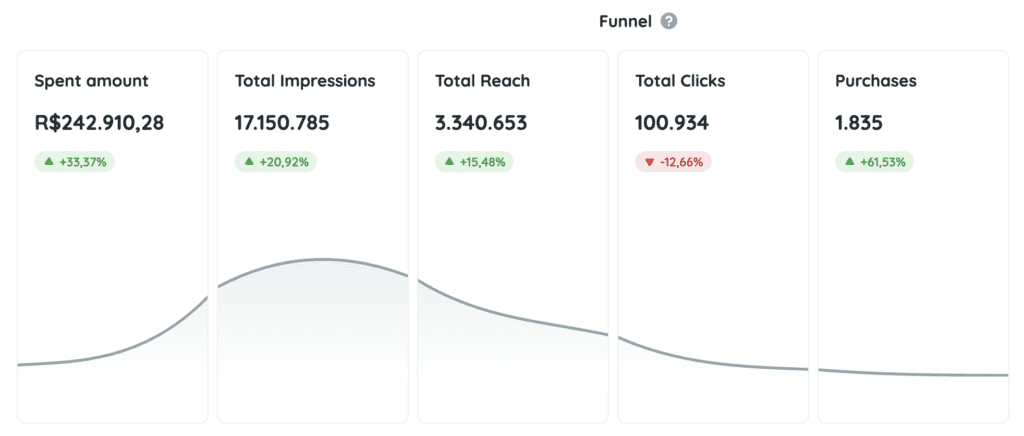
Social Media
On social media, you can also conduct an analysis in funnel format, comparing how your posts have generated reach, engagement, and interactions at various touchpoints on your profile – such as clicks on the website link, message inquiries, among others.
If you have this data, you can manually add a metric that demonstrates how many followers got in touch through the channel to request a quote, make an appointment, or complete a purchase, reaching the bottom of the funnel through social media.
E-commerce
For those with an e-commerce business, it’s also possible to conduct performance analysis through a funnel created in Google Analytics 4, with a focus on e-commerce data.
By adding metrics at different stages, you can illustrate the entire journey from site arrival, product addition to the cart, purchase completion, and total revenue. This way, you can pinpoint which stages are truly delivering the expected results and which ones require more attention in your project.
Create and save unique templates for your projects
Did you see how convenient it is to create a Marketing Funnel in Reportei and use it for more strategic analysis in your projects? The best part is that the effort to set up the funnel only needs to be done once, as the templates can be saved and reused whenever you like.
In other words, you can replicate the customized layouts for the same or different clients, automatically capturing metrics from each channel in just a few seconds, allowing you to focus on what matters most: your analysis and gaining insights.
As a result, the process becomes more efficient and creates room for planning more strategic actions across all channels.
Take advantage of our 3-day free trial and discover how Reportei can help make your sales funnel analyses more effective!
