Discover advantages and tips for creating more efficient marketing dashboards with Reportei
Creating a digital marketing dashboard for your projects is essential to closely monitor the results of your strategies, making decision-making and adapting to changing scenarios more agile.
There are various models available in the market that can suit your clients’ needs, including Reportei, which offers a dynamic and customized panel to control metrics with greater precision.
Next, we show you how to use Reportei to create more efficient digital marketing dashboards and the advantages this tool offers. Follow along!
How to Make a Dashboard in Reportei?
Just like creating your reports in Reportei, setting up your dashboard on the platform is very practical. You simply choose the channels you want to monitor closely and an initial analysis period to automatically import metrics in a few seconds.
You can even choose between different dashboard models, considering the objective of your project, with templates focused on social media, inbound, paid traffic, and more.
Once the panel is generated, you have complete freedom to navigate between different dates and comparisons, customize the layout to highlight the most important results, and share the report with clients or the team.
Moreover, as there is the possibility to customize the dashboard, you have the ease of creating the most efficient panel for each project, considering its objectives and goals. Check out some essential tips to do this with Reportei’s resources!
Organize Results According to the Inverted Funnel
To create a digital marketing dashboard that helps quickly visualize the most important results, it’s ideal to develop the panel using the logic of the inverted funnel: that is, highlighting the most impactful metrics and channels before any other results.
For example, if the project is inbound, it’s worth bringing first the sales metrics and business opportunities from the CRM, then working with lead nurturing data, and attracting visitors to the site.
With this structure, you can detect problems in the funnel more quickly and work on more effective short-term actions.
Leverage Reportei’s Marketing Funnel Functionality
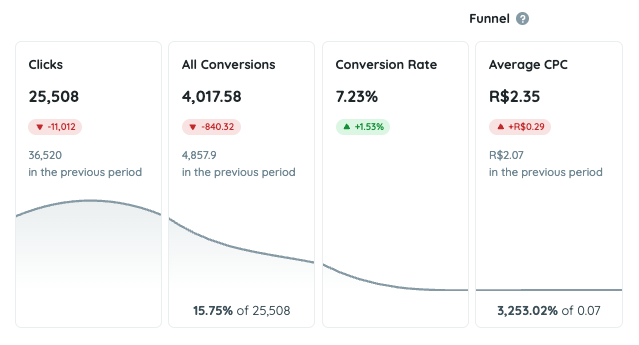
Another feature you can take advantage of in Reportei, in addition to dashboard customization, is using the marketing funnel for each channel.
The graph can be built to allow analysts and decision-makers to visualize the customer journey in a simpler and integrated way, helping to understand how strategies impact the final result and where the main bottlenecks that need to be resolved are.
Know Which Metrics to Keep on the Panel
One of the main secrets of making a good dashboard is knowing which metrics to keep and which to add to make reading results more efficient. After all, the panel’s proposal is precisely to offer quick visualization and decision-making in routine, right?
In the dashboard example below, you see a construction that highlights the investment made in Google Ads, brings data related to user interactions, and finally, the value of all conversions obtained at the end. That is, the financial result of the budget applied in the analyzed period.
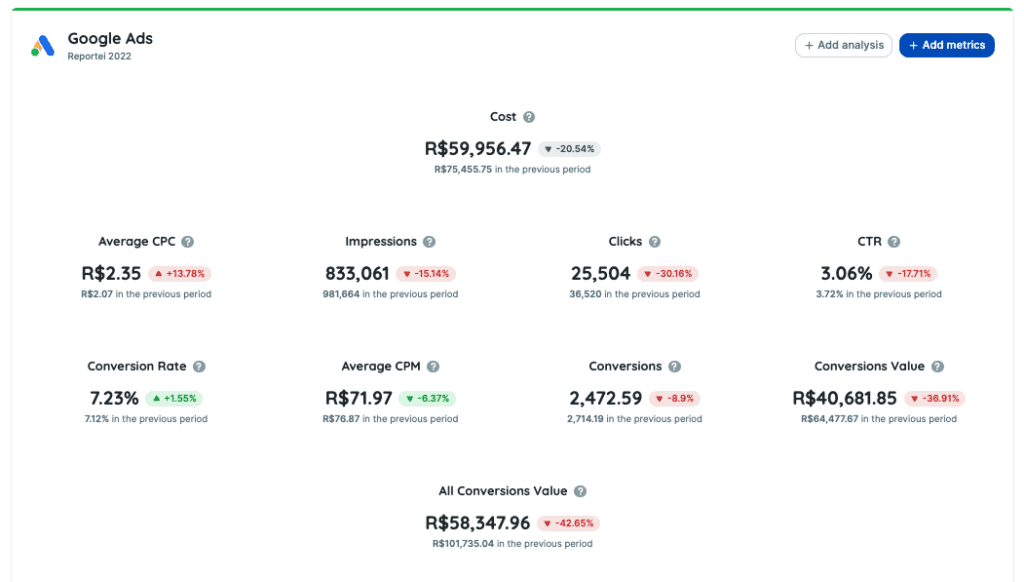
Creating a simpler visual – and one that has logic behind it – will help analysts extract information much more quickly and efficiently.
Add Analyses on Channels
Besides the metrics captured automatically by dashboards, there is the possibility of adding analyses (in text, image, and video) to complement the data and offer a more complete view of the history of your actions.
Each channel can have its own analysis with the context of your strategies, allowing the freedom to navigate between different periods while keeping a close eye on specific information about the project.
Save Dashboard Templates in a Few Steps
Finally, it’s important to emphasize that customized dashboard templates can be saved and used later as a base for other similar projects in your client portfolio.
Thus, there’s no need to always create a new template from scratch, which provides greater efficiency in the analysts’ daily routine.
Why Create Digital Marketing Dashboards in Reportei?
The dashboards offered by Reportei confer a series of significant benefits, promoting greater dynamism in digital marketing teams and facilitating strategic decision-making for projects. Among them, the highlights are:
- Efficient centralization and organization of information, meeting the specific demands of each team or client;
- Ease of switching between different periods of analysis and comparison, eliminating the constant need to create new reports and providing greater agility in decision-making;
- Real-time data visualization, keeping everyone updated on campaign performance and allowing immediate identification of obstacles and opportunities;
- Availability of multiple dashboards according to the plan contracted in Reportei, enabling the creation of distinct panels for different channels, strategies, or specific analyses, optimizing management and facilitating communication with clients.
In summary, by creating dashboard models with Reportei, time is optimized, and efficiency in optimizing strategies is maximized, making clients see more value in the services provided.
In addition, Reportei offers other resources that make the routine of analysts more practical, such as:
- Unlimited report creation to record project evolution and share data with clients;
- Report automation, so you don’t have to manually generate the document every month;
- Use of Reportei Control (only in the premium plan) to closely monitor your goals and indicators, and make more agile decisions to achieve them;
- Use of artificial intelligence (Reportei AI) to create automatic analyses in reports and obtain valuable insights with paid traffic and Instagram assistants.
Take advantage of our 3-day free trial now and discover how Reportei’s dashboards and reports help in a more strategic routine for digital marketing professionals!
