Learn how to customize the theme of your marketing report and change the colors of the charts for each analyzed network
Customizing your digital marketing report is a practical way to align it closer with your client’s brand and make its reading more enjoyable. Therefore, one of the features we have released on our platform is the customization of themes, allowing the change of color palettes in charts.
In this article, we cover everything you need to know about this new feature, how to access it in your account, and what other customizations can be made in Reportei’s reports and dashboards. Read on!
What is Reportei’s Report Theme Customization?
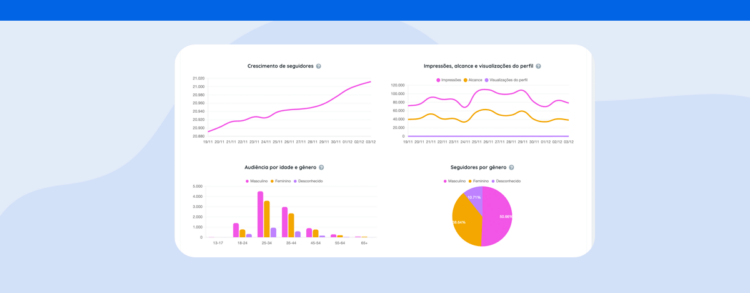
Besides having different colors to identify social networks and the freedom to change the cover of your report, Reportei now enables the change of themes in the charts presented in the document.
With this, you can choose from predefined color palettes that make the most sense for your client’s brand or that will assist in the reading and interpretation of data, for example.
This means you can further highlight information in the charts by opting for warmer colors, making them more neutral compared to other metrics, or even creating greater contrast between the lines, columns, or slices themselves.
Moreover, the theme change can be applied to the entire report, altering the colors of the charts for all integrated networks, as well as for specific channels. See below how this works differently!
How to Change the Themes of All Charts
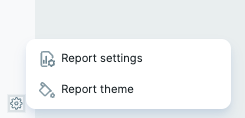
To change the theme of your marketing report, first, you need to click on the settings button available at the end of the list of networks you are analyzing. Then, simply select the “Report Theme” option for the color palettes to appear in the control bar.
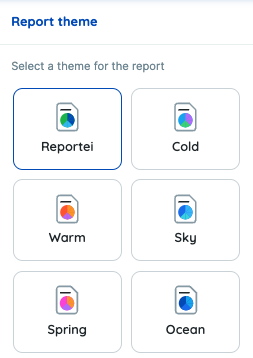
In total, there are 16 available themes with different compositions for you to choose the one that best fits your report or dashboard. Among them, we have Reportei’s classic theme (with shades of blue and green), Cold, Warm, Sky, Spring, Ocean, and many more.
Selecting a palette in this tab will already change the colors in all the charts present in the document, and the change will be automatically saved.
How to Change the Theme of Charts in Specific Integrations
However, if the goal is to choose themes according to each integrated channel – to match the colors of the network, for example – the path to make this customization will be different.
In this case, you should click on the settings button located within the channel, available in the upper right corner near the “Add Metrics” button.
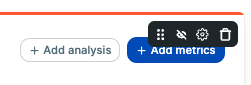
This will open the block’s settings tab in the control bar and show the same list of theme options, so you can choose the one that best suits your needs. Once done, the change will be made and automatically saved in the report for that specific network.
Additionally, it’s worth remembering that these layout changes can be saved as an exclusive template – for use in the same or other projects in your account.
All this comes along with the possibility of adding text, image, and video analyses about the results and saving the templates to use them again whenever you want.
In short, with Reportei you have total freedom to create your digital marketing report, ensuring it meets the client’s expectations, from defining the most important metrics to customizing the theme of the charts. Take advantage of a free 3-day trial to explore all the functionalities!