Check out the details of the new Google Search Console report from Reportei
Now, Reportei has another incredible feature to assist in the performance and optimization analyzes of your website or your client: the Google Search Console report.
This tool, which has become increasingly essential for the work of a digital marketer, offers critical information about a website’s traffic, its performance in Google searches, and how users reach it.
With the metrics provided by the Search Console, you can understand how Google sees your pages and implement technical improvements that help to boost organic results.
In our report, for example, you find the main data related to Search Traffic, which shows what people are looking for that makes them click – or not – on your links.
In other words, you can go deeper and extract relevant information on questions related to keywords, pages that stand out the most, and where these users come from
Along with the Google Analytics report, this new feature of Reportei allows you to have a complete view to create more effective marketing strategies for your business or your client.
Below, we will present everything you find in the Search Console report. Continue reading and get to know every detail!
The top 4 metrics in the Search Console report
Reportei’s report displays four critical metrics for performing your analyzes and optimizations. Check it out:
- Clicks: This is the total number of clicks on the Google results page that brought users to your site.
- Impressions: How many views the links to your website received on the Google results page.
- Click-through rate (CTR): the Click-Through Rate shows the number of clicks divided by the number of impressions. When your CTR is high, it means that your website is attracting users’ interest.
- Average position: shows the average position of the main result of your website in the Google ranking.
But the data collected by the report does not end there. These metrics are the basis used to gather other important information for the marketer. Let’s see what they are!
Keyword tables and featured pages
Based on clicks, impressions, CTR, and average position, we developed two relevant tables for analyzing your search performance: that of highlighted keywords and that of featured pages.
The first is a compilation of terms that returned your website in response to a Google search.
The number of clicks orders it, but it presents all the other metrics so that you can understand if these keywords are generating positive results for your website and how they can be used in your favor.
The second table shows the main links that are displayed and accessed after a search. Like keywords, it is also ordered by clicks and displays other data to help you identify which perform better.
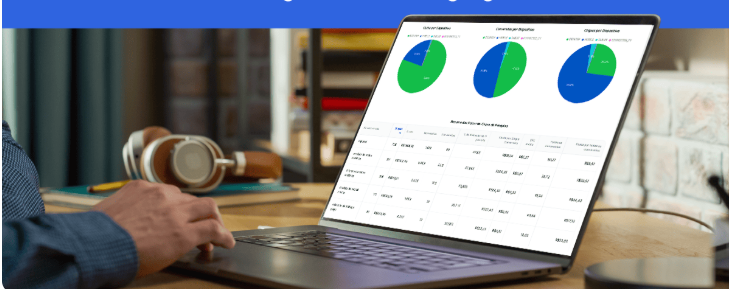
Access graphs and featured countries table
In addition to the metrics and these two tables, the Search Console report also shows other important information about your website’s performance.
One of them presents, for example, graphs about the accesses to the pages, identifying how many clicks and impressions came from desktop, mobile, and tablets.
With people using more and more smartphones for everyday tasks, this is an excellent way to assess whether your website is responsive and how you can make improvements to meet your audience’s preferences.
There is also the table of featured countries, which brings together a list of the main places that accessed your pages (ordered by clicks), impressions, CTR, and average position in each one.
If there is considerable access outside of your country and it is interesting for your business, why not optimize your website for other languages as well?
How can the report assist my website strategy?
As we saw in this article, the Search Console report presents a series of data about how Google sees your website and how users reach it.
Now, with the information in hand, we need to roll up our sleeves and start working on building a more effective strategy so that people not only see your pages in the ranking but also click on them.
First of all, pay special attention to the keywords that increase your traffic. They can be quite an investment to make your results even better.
Second, see if the pages you think are relevant perform well. If they’re not performing as expected (with low CTR and average position), it’s time to optimize them and make them more attractive to your audience, right?
Finally, understand the behavior of your website’s users and adapt your content to facilitate their access, regardless of the device used.
This not only makes their experience much better, but it also makes it easier to carry out the optimizations identified from your first tips.
Did you like to know the details of our Search Console report? Then log in to your account or create an account on Reportei to test this new functionality on our platform!