Learn how to use the calculated metrics function to create unique formulas and compare data across different channels integrated into Reportei
For those who need to create increasingly customized reports, having the option to record data that meets the specific needs of their clients is crucial.
That’s why Reportei recently launched calculated metrics: a practical way to create a relationship between the most important account information, comparisons between results of the same channel, and much more.
In this article, we tell you everything you need to know about the functionality, how to create your calculated metrics in reports and dashboards, and introduce other new features that help go beyond the automatically generated document on our platform. Follow along!
What are Reportei’s Calculated Metrics?
Calculated metrics have been introduced in Reportei to allow you, when creating a metric manually, to add, subtract, multiply, or divide the results according to the information you or your client need to understand the progress of the project.
For example, let’s say the relationship between reach and impressions of a profile is relevant to understand its presence on a specific social network and how many times the contents are shown on average to the same person.
Today, this metric is not automatically calculated in reports like those of Facebook and Instagram. However, you can now add it to the template and discover how much your posts are exposed to the same user, how this interferes with engagement, among other important points for the strategy.
Calculated metrics are part of all Reportei integrations. Thus, it is possible to find various ways to visualize and understand the available data, which contributes to obtaining more valuable insights in the project routine.
What is the Difference Between Calculated and Manual Metric?
If you already generate reports in Reportei, you might be wondering what differentiates calculated metrics from the manual ones that already existed in the reports, right?
Both are widgets that need to be configured by the user to show a specific result and are even available together in the report setup. However, the manual metric brings a “static” information, which will be inserted in the document and will not be automatically updated if you change the analysis period.
On the other hand, calculated data are composed of a mathematical relationship between predefined or manual metrics, standing out as a new formula for your reports and dashboards.
This way, even if you change the dates for comparing the results, these data will be updated along with the others – if they are composed only by predefined metrics, which are captured automatically.
How to Create a Calculated Metric in the Report?
Adding a calculated metric in Reportei is very simple. As we said before, it follows the same flow as the manual, so you just need to click on “Add metrics” in the desired network and drag the “Metric” option to the report.
Having done this, you can select the option of calculated metric and start configuring it. The initial process involves choosing a title and a description that helps identify what this result is about – this step is essential if you send this report to the client, for example.
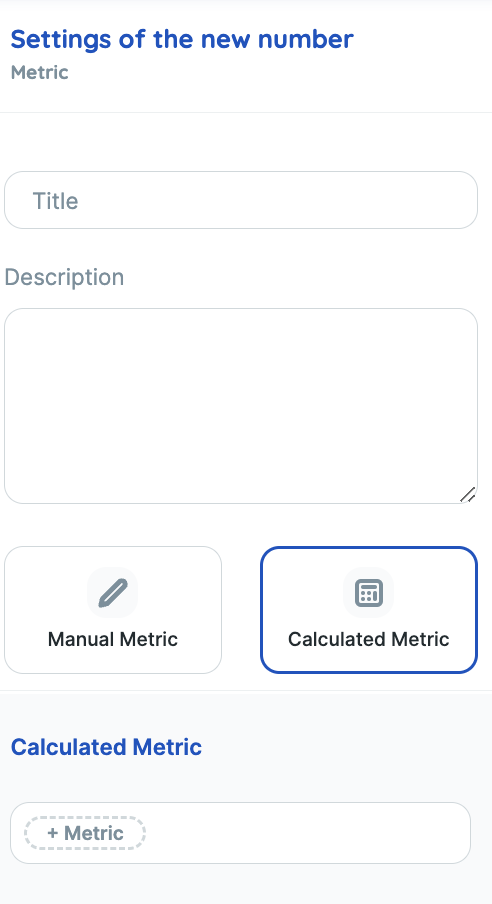
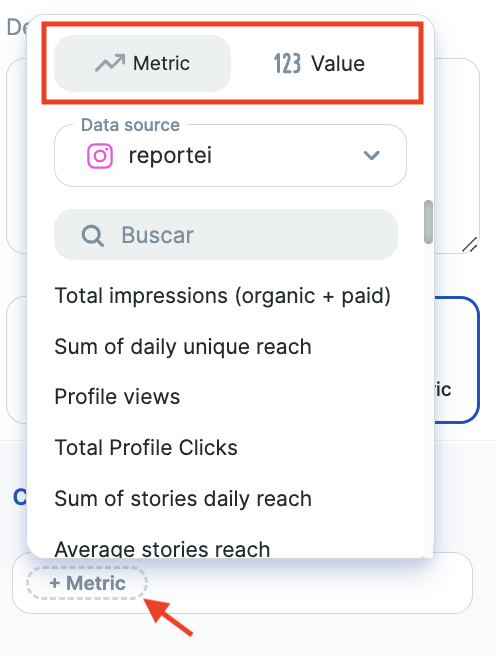
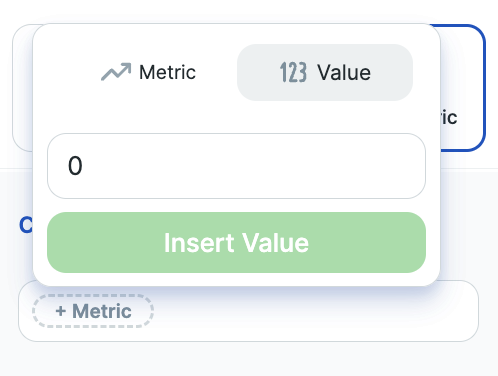
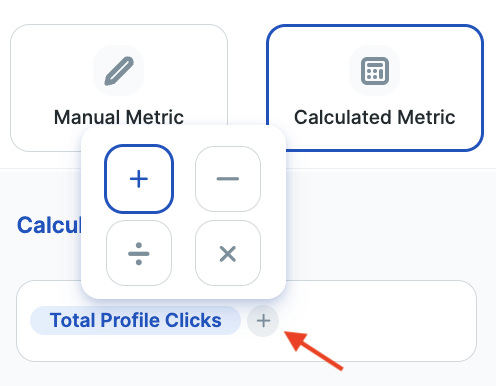
Next, you will start creating your formula using the predefined metrics of the channel or adding information manually, as shown in the following image:
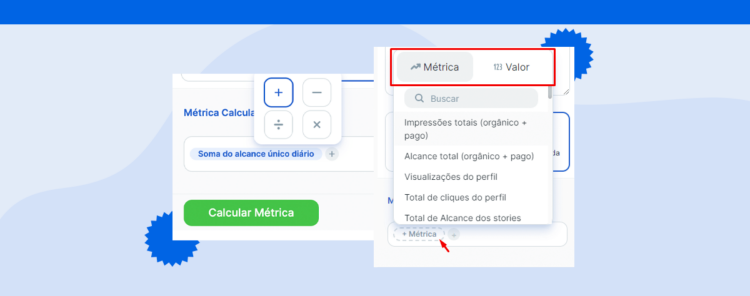
Then, simply select the desired mathematical operation by clicking on “+”. As we said earlier, there is the possibility to add, subtract, multiply, or divide, as necessary.
To conclude, just add the other metric that will be part of the formula and click on “Calculate metric”. The result will start to appear in the report, including the result of the previous period, allowing a comparison between the data.
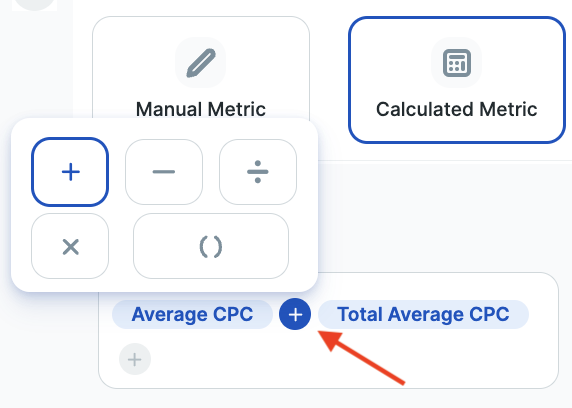
Moreover, for those who need to work with more complex calculations, it is possible to add formulas with parentheses. However, this option will only be shown in the selector after adding some operation, as we can see in the following example:
The parentheses encompass the metrics that are to the left and right of where they were added. Having done this, just continue with the formula and save it to see the result in the report.
If you need to use calculated metrics regularly, you can also save the template in which they were created and select it whenever needed, in the same or other projects.
Create Custom Metric Blocks for Your Reports
Along with calculated metrics, another new feature that recently arrived at Reportei is the custom blocks, which can be added to client reports and dashboards to function as a summary of the presented results or even to represent a channel that is not yet integrated with our platform, such as WhatsApp.
This space allows various manual actions, such as:
- adding metrics from different integrations in the same block, to facilitate the general view of the results;
- adding manual metrics and analyses;
- creating calculated metrics with different integrations, i.e., developing formulas and calculations with data from different networks;
- grouping data, adding the same metric from different networks (such as reach on Facebook + Instagram);
- creating marketing funnels and charts with metrics from different integrations.
To create a custom block for your report, simply click on “Add new network” in the control bar, configure the title and description, and start adding the most relevant data for your analysis.
In addition, it is worth remembering that Reportei also allows various other customization actions, such as changing the layout of metrics to highlight the most important results, swapping the order of channels, grouping data in charts for longer period readings, and much more!
With this, you can have more freedom to create the document according to what meets the needs of the team or the client, and extract insights more easily in the routine.
Liked learning about the calculated metrics functionality and the custom blocks of Reportei? Then don’t forget to access your account or start a 3-day free trial to get to know these and other features of our platform closely!