The Instagram metric analysis is an essential starting point for understanding; in fact, how your followers behave on this network and what can be done to make your strategy reach them as effectively as possible.
As with any other social network, this assessment leads to the interpretation of information, testing, and critical changes for a brand evolution.
But before any analysis, you need to understand what these metrics tell us, right?
So we prepared this post, especially to present the data that Instagram offers in the app (which is available in our report as well) and what they can say about your strategy.
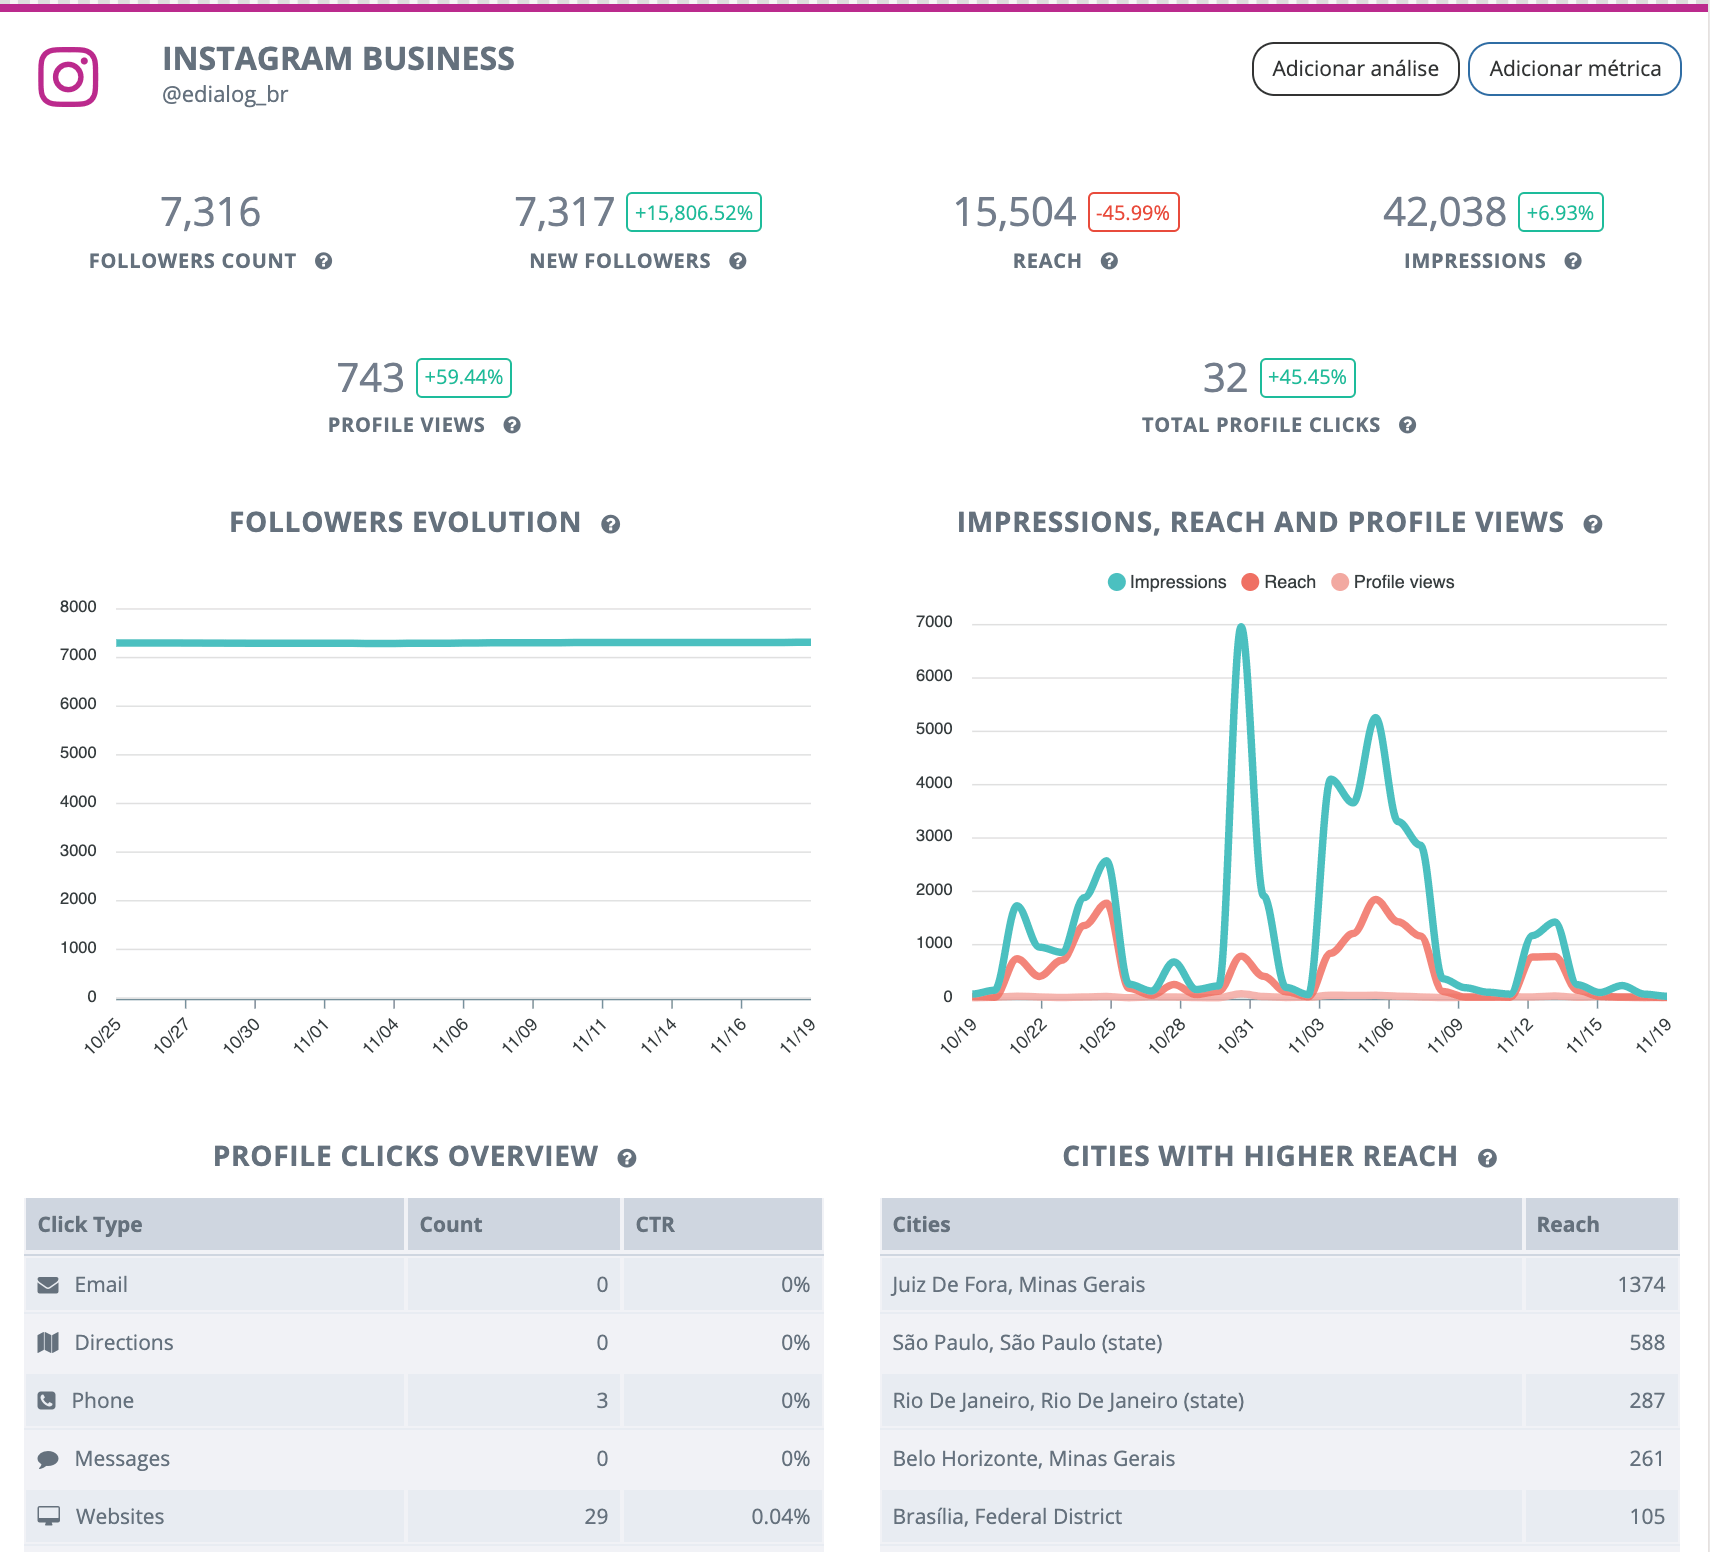
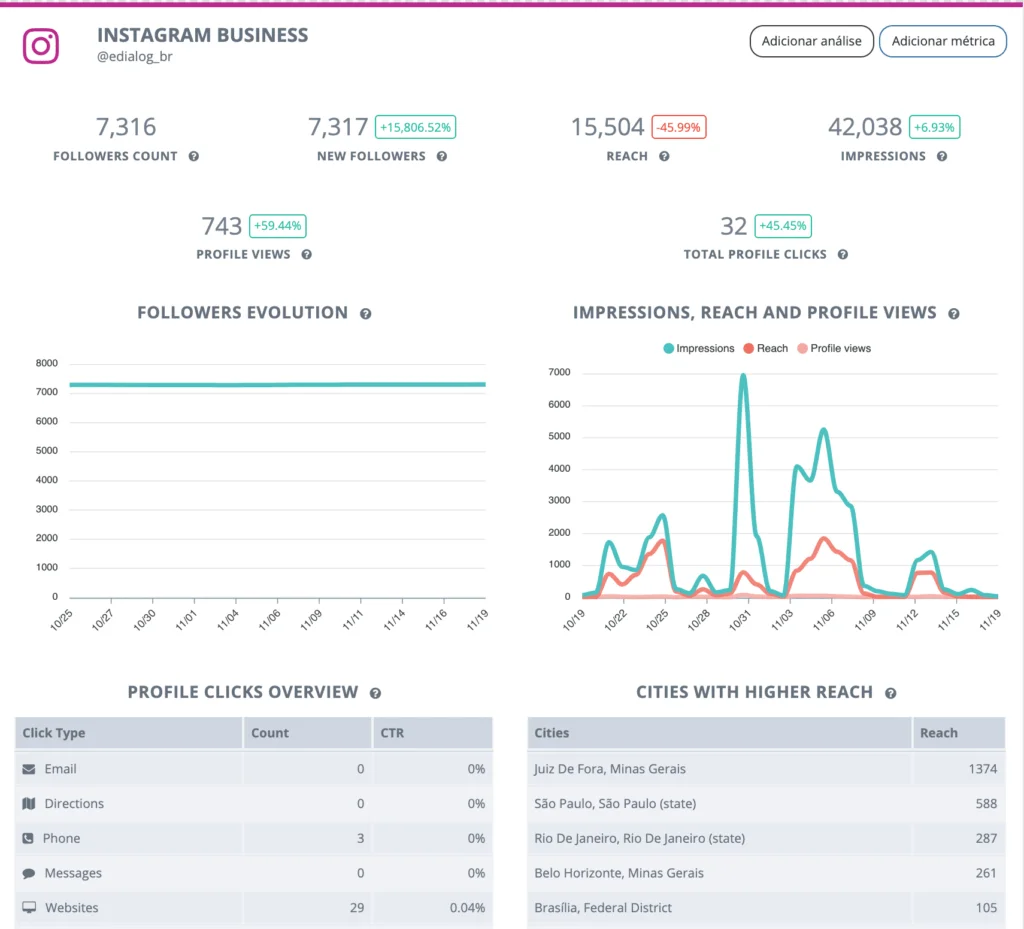
Example of metrics in Reportei’s report
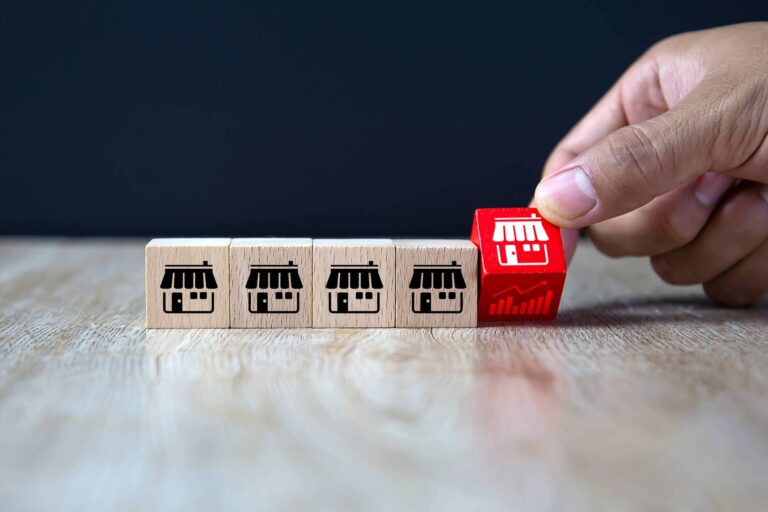
Why track Instagram for Business metrics?
For those working with digital marketing and social networks, metrics analysis is an essential step in assessing the performance of actions taken and driving continuous improvement in results.
To facilitate this access to information, Instagram, which is one of the leading consumer-brand networks, developed Instagram Insights.
This feature, which emerged in 2016, can collect the most relevant data on business account performance and help clarify ideas about what is working and what is not.
As such, the metrics provided by this functionality are essential for creating profile performance reports and for carefully analyzing some critical aspects for enhancing the strategy used on Instagram. They are:
- get to know your followers better, understanding who your audience is and how they behave on the network;
- track the reach of posts to focus on content that is most likely to reach the audience;
- understand how audiences relate to the brand and what improvements can be made to increase engagement levels in both feed and stories.
If your account is not yet enabled to use this feature, simply go to your profile settings to make it a business profile, connect it to your Facebook page, and change your contact and location information. Simple, isn’t it?
8 Instagram metrics to measure the success of your strategy
With a business account for your profile or those of your customers, you can leverage Instagram metrics to analyze results and get new ideas on how to improve your strategy.
Listed below are eight critical metrics and what they have to say about your account performance. Check it out!
1. Number of followers
“Followers” is the metric that exposes the number of users who followed or unfollowed your profile during a given period.
This data is hugely relevant to show if the profile is developing according to your goals and helping you analyze which strategies are crucial to achieving better results.
2. Profile Views
The number of views is responsible for showing the number of visits the profile received in the analyzed period and comparing it with previous periods.
With this metric, you can evaluate the strategies you use to drive more views to your account and determine how these results can be improved.
It’s important to remember that post frequency makes all the difference in getting more visits and being able to analyze this data more clearly.
After all, if you don’t publish anything new for a long time, few users will know your profile and be interested in visiting you, right?
3. Reach
Reach is the metric that shows how many unique profiles saw your posts during the time.
Like the number of followers, reach data is also excellent for measuring profile growth as it takes into account the total number of accounts entered and which posts are performing best. In the Reportei‘s report, posts with the best reach and engagement results are listed as “featured,” which facilitates this analysis of the type of content that most impacts the audience and generates the most interactions.
4. Impressions
Unlike reach analysis, the number of impressions shows how many times your posts have been shown to people, regardless of whether they are seeing them for the first time or tenth.
This is precisely why this amount will always be higher than reach and a good starting point for comparing which content is reaching the most people (i.e., single accounts) and which publications are being shown to the same users repeatedly.
5. Profile Clicks
Profile clicks gather all data regarding user interactions with the information you provide to let them know and contact your business.
In addition to measuring clicks that direct to the website, this metric also shows how many people were interested in sending an email and getting your location or phone number, for example.
How well these results perform depends significantly on your business goals and what types of interaction you prioritize for your followers.
But it must be emphasized that the right call-to-action (CTA) in publishing always makes a difference when it comes to directing people to more direct contact with your business.
6. Characteristics of the audience
Knowing the age group, location data, and gender of followers who engage with your brand allows you to develop more useful content to reach your audience.
This information is also essential to better target ads that are made for this network and to adopt a language that is more in line with your target audience.
It’s worth remembering that for better analysis and insights, you also need to keep an eye on the times and days of the week when your followers are most active on the network.
After all, it’s this data that helps you understand your audience’s behavior and leverage the reach and engagement of your content.
7. Engagement
In engagement metrics, we find all the data regarding how the audience engages with the brand.
Comments and likes, for example, indicate which posts generated the most interaction with users and how your followers see your content.
The success of your strategy can also be measured by reviewing publications that are saved by followers. After all, if they clicked “save,” that means the content was useful, and there was an interest in reviewing this post later.
So why not leverage this insight to plan and produce more content focused on what your audience sees as valuable to them?
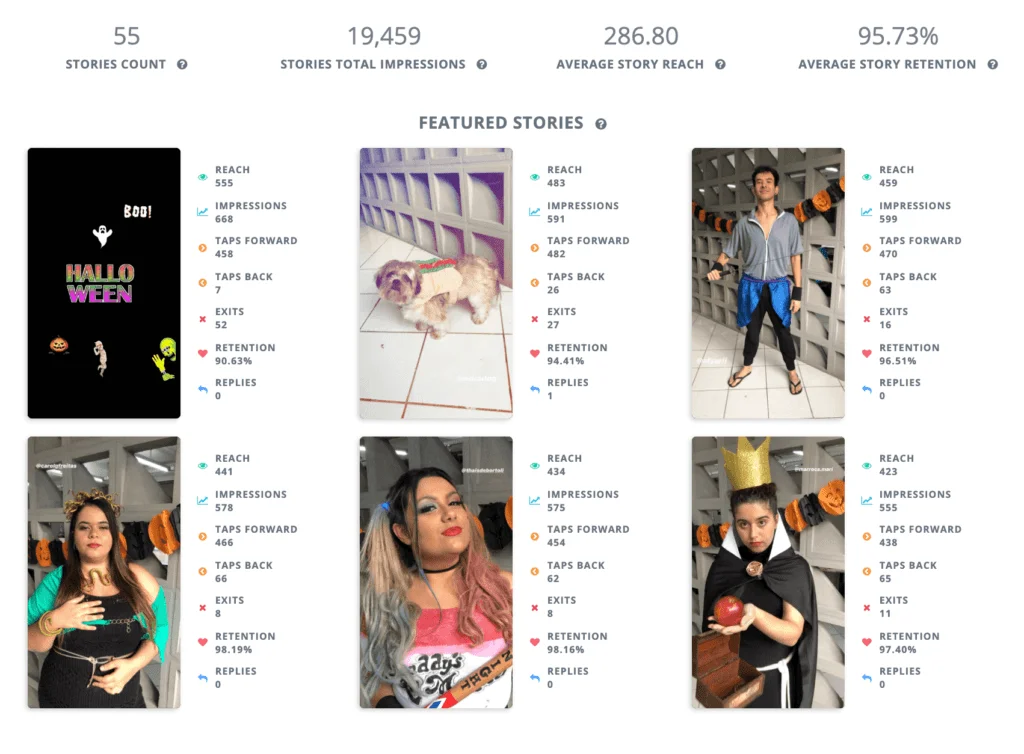
8. Stories
As with feed posts, you can also analyze stories’ performance from Instagram Insights metrics.
In addition to reaching and impression number, stories also provide insight into all sorts of interactions a person may have with posts, such as forward or back touches, message replies, and exits from users who have left their stories.
Again, it is noteworthy that this data is very relevant for those who want to make Instagram content more strategic and target it to a more specific audience.
This information also allows you to strike a balance when planning content, avoiding overcrowding of stories over a while or missing them for too long.
Instagram for Business Metrics in Reportei
To make it even easier for you to analyze your results and communicate with the customer, the new customizable report from Reportei now has Instagram for Business metrics!
That’s right; all this data provided by Instagram Insights can be found in our report, along with graphs and comparisons that help you evaluate profile performance over the selected time.
Besides, the new version of Reportei also lets you choose which metrics to use and customize templates that can be saved and reused for one or more accounts.
Reporting is then entirely focused on your customers’ goals and the strategies you have set for their social media. Much easier, isn’t it?
Now that you know Instagram for Business metrics and Reportei’s customizable report, simply sign in or sign up to try out the new features!