
TikTok Ads Reports: the inside scoop on Reportei’s new feature!
That’s right! TikTok Ads reports have come to help make your social media campaigns even more elaborate!
You can integrate accounts, generating reports in seconds for key metrics data, performance graphs, and of course, individual campaigns and ads results.
Easily accessible data is a practical way of gaining insights, helping you plan and invest more efficiently.
Want the details on Reportei’s TikTok Ads reports? We’ll cover them below with everything you need to know about using our reports to capture data. Keep reading!
Here are 12 main metrics available in Reportei’s TikTok Ads Reports
Integrating your TikTok Ads account with Reportei allows you to access your most relevant TikTok results with a few simple clicks.
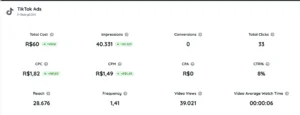
You can check out your reach, views, costs, and a lot more through these metrics:
- Impressions: the number of times your ads were displayed on screens;
- Reach: the number of users who viewed an ad at least once (estimated data);
- Frequency: average times an ad was viewed by an individual account;
- Video views: the number of plays (replays not included);
- Average display time of videos: the average watch time of videos during a session;
- Ad Clicks: number of clicks on ads;
- CTR (Click Through Rate): Percentage of clicks on a viewed ad;
- Conversions: number of times your ads reached specific campaign goals;
- Total Cost: Estimated amount spent on long-lasting campaigns for selected periods (only includes TikTok Ads Manager expenses);
- CPC (Cost Per Click): Average spent per click;
- CPM (Cost per Mille): Average spent per thousand impressions;
- CPA (Cost Per Action): Average spent per conversion.
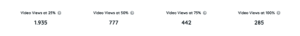
There are four other metrics for video plays to help you understand user interaction. Check them out:
- 25% audience retention on videos (the number of video plays; replays not included);
- 50% audience retention on videos;
- 75% audience retention on videos;
- 100% audience retention on videos;
And adding a comparison period to your report helps you gauge whether numbers have gone up or down. That will help you learn what content encourages engagement on TikTok and what strategies to optimize.
Analyze campaign performance through graphs and tables
Besides metrics, TikTok Ads reports automatically generate graphs and tables to help you monitor ad campaign data in depth.
Graphs display the performance of costs, impressions, clicks, and conversions over time. And that’s not all! Three additional graphs break down impressions into age groups, platforms, and genders.
Tables allow you to analyze the results of your campaigns and featured ads (costs, impressions, and conversions) and the countries or regions your ads were running in.
Is there any data you feel we may have missed? Don’t worry! You can customize reports in Reportei, add metrics (even manually), decide what info to highlight, and switch your graph design.
Our reports also allow for text, video, or images to complement the data in your analysis.
Gain useful insights from your TikTok Ads results
If you run ad campaigns on TikTok to promote your business, our reports will be a rich source of insights to help you optimize your ads.
You can analyze reach, audience engagement, and conversions in-depth, comparing costs and optimizing future investments.
You can also monitor campaigns and content to gauge performance which comes in handy for planning new actions or testing new strategies.
What are you waiting for? Use Reportei’s resources for your TikTok Ads reports for a more strategic online presence!