Reportei version 4.0 arrived with many new features. Check out all the details below!
After six years and a trajectory full of evolutions in our platform, we are pleased to announce the most significant update in our history: Reportei version 4.0 is here.
For our team, this release isn’t exactly new. This version has been part of our plans since 2015, when the company was founded.
Today, with more than 20,000 companies generating their reports on our platform every month, our biggest goal is to improve our customers’ experience with a version that features a new design and a new architecture, more available metrics, and more customization possibilities.
This article will show you everything that has changed in Reportei version 4.0 and how to access the new platform. Check out!
9 updates in Reportei version 4.0 for you to know
Yes, Reportei version 4.0 arrived with nine updates to optimize your reporting further and deliver a complete analysis to your decision-makers.
By the following feedback from our customers and past goals of our team, we seek to transform our platform into a space that prioritizes practicality and intuitive navigation. All this, within a new, more flexible architecture that allows for more frequent updates and the inclusion of new metrics. Next, you can thoroughly check everything that has changed!
1. Newly designed platform and reports
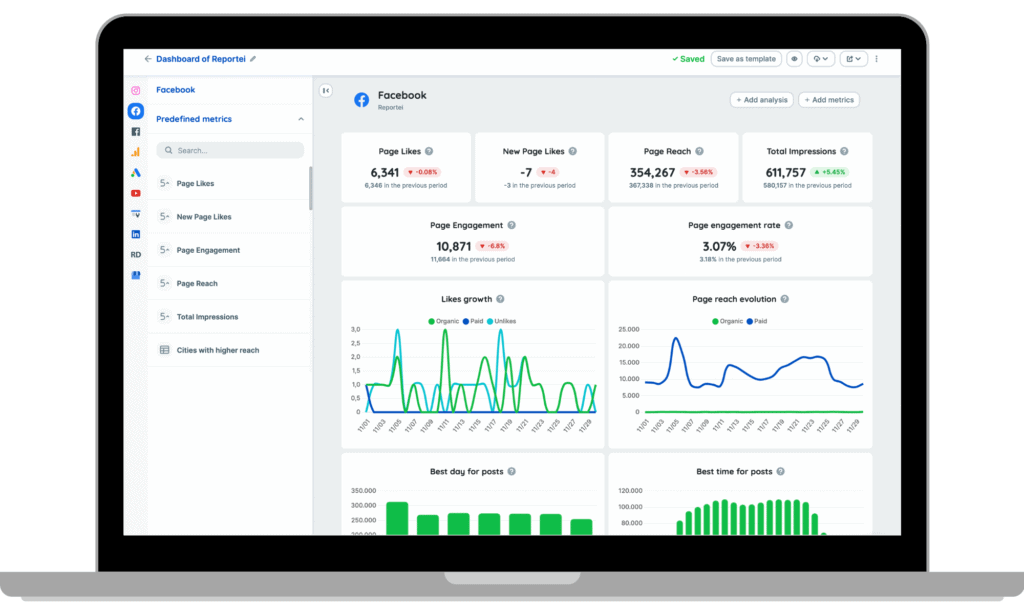
Right away, anyone who already has access to Reportei 4.0 is faced with a significant change: the new interface, which, in addition to being cleaner and – modesty – beautiful, facilitates browsing through customer accounts and the features available in the software.
This visual update extends to reports, which gained animated graphics, more robust tables, and new metrics, as we’ll explain in more detail in the following topics.
All of this, of course, is keeping your freedom to customize the template and define what is most relevant to your customer or decision-maker.
2. Customer Management Dashboards

This redesign had a significant impact on the account management dashboards. First, it’s easier to visualize all your company’s customers and organize them according to what’s best for your team: alphabetical order, the last customer-created or last report generated.
We also have a search bar to speed up searching within the account and a “Manage Team” button to see who’s on your team and add/remove members.
In addition, we’ve released an account health index that considers recurrence when generating new reports. Above each customer’s logo, you will see a heart icon to signal to do. If it’s green, it means you’re keeping the decision-maker informed, but if it’s orange, it means he needs more attention.
When you click on any client, you will access an individual panel, which shows all Reportei functionalities in blocks: Reports, Dashboards, Timeline and Automations.
The last actions performed on the account and the possibility of managing/creating activities according to your needs are listed in each of them.
There are buttons at the top of the panel to manage the specific team for this project and manage the integrations, which are also much more intuitive. Even if an orange attention notice appears on your customer’s social media icons, it means you need to reinstate that channel.
3. Easier generation of reports and dashboards
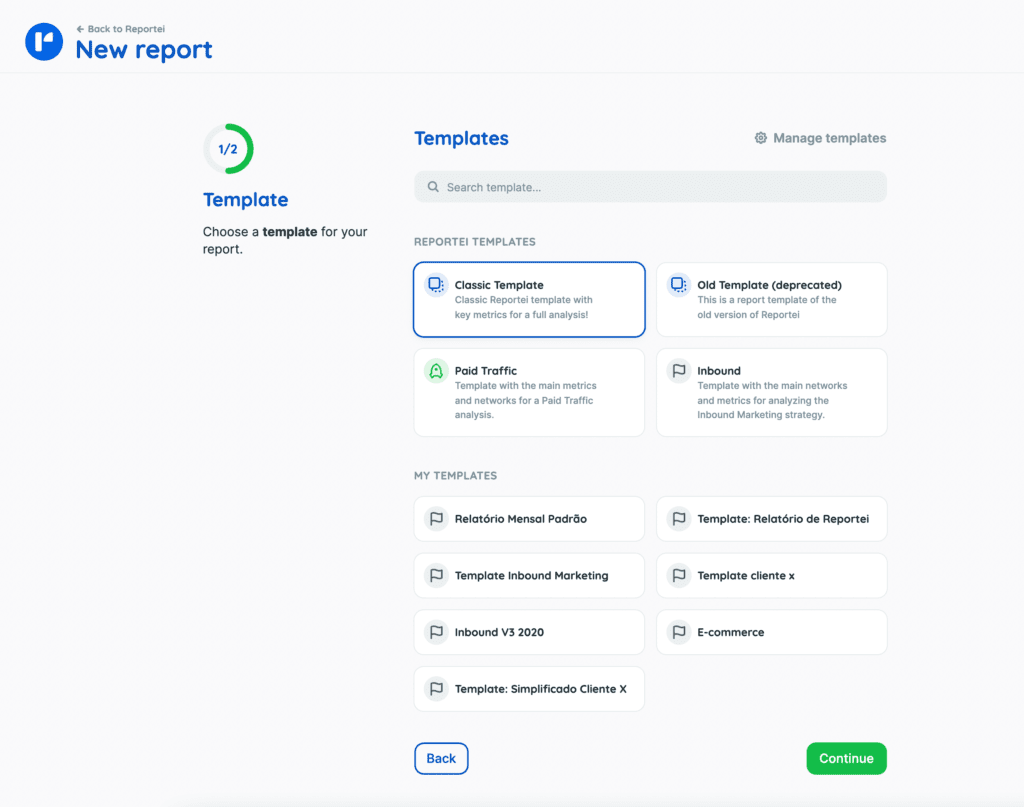
As the focus of Reportei version 4.0 is to simplify your experience as much as possible, it is now possible to generate your reports and dashboards in just two steps.
Just choose your template — the classic model, the old one (available in version 3.0), or some customized template saved in your account — and, in the second step, define the analysis period, the media, and whether you want to capture data from all the ad campaigns or select the ones you’ll need to present to the decision-maker.
And voila! Your report will be ready to be analyzed in a few seconds and with all the metrics you need.
4. New possibilities for editing reports and dashboards
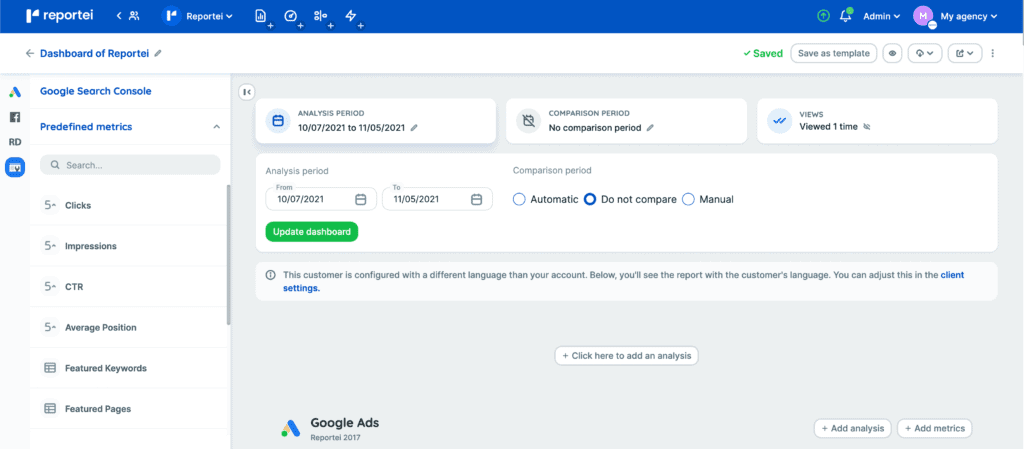
But wait, there is no more the step of setting the title of the report then? Take it easy at this time because now comes the bombastic revelation: Reportei version 4.0 allows you to edit the title and subtitle whenever and however you want!
What’s more, the news doesn’t end there: you can also edit the dates of the analysis and comparison periods after the report has been generated.
In this case, the report differs from the dashboard in the version sent to the customer. While in the first one, he will have a static document of the analyzed period, in the second, he will have the freedom to change dates and comparison periods to fetch the results on his own.
Another significant change in this new version is that we have expanded the possibilities for editing charts, tables and metrics. This then means that you have even more freedom to customize reports and dashboards.
If it’s already nice to see that the graphics are animated, imagine finding that you can edit them and choose between three format options: line, bar, or pie? Because now Reportei also offers this option!
When editing tables, you can choose the number of lines your client will view, the metric that will order the ranking, and whether it should organize them into ascending or descending tables showing more metrics than you’d like to offer? In her settings it is possible to hide the columns and focus only on the data that matter to your customer. Notable, isn’t it?
5. New metrics available

Reportei version 4.0 also has new metrics to make your reports more robust and offer more insights for more strategic decision making. Below, you can check the list of data that are now part of social media:
Google Analytics | E-commerce Metrics :
● E-commerce conversion rate;
● Transactions – total number of purchases made through the website;
● Revenue;
● Average order value;
● Unique purchases;
● Performance Table by Product;
● Revenue table by city;
● Sessions for transaction;
● Featured Channels Table (Channels with the highest revenue);
● Fee of products added to the cart by detail;
● Purchase rate per detail;
● Quantity added to cart;
● A number of product checkouts.
Google Analytics | Goal Metrics:
● Goal conclusions;
● Goal value;
● Goal Conversion Rate;
● Total dropout rate;
● Completion of each goal;
● Goal Completion Location Table;
● Source/Media Table (the combinations of sources that generated traffic);
● Chart of goals completion over time.
Facebook:
● Best day and time charts for posting;
● Page Engagement Rate;
● Engagement rate of publications;
● Total engagement of posts;
● The full reach of posts;
● Organic reach of the page;
YouTube:
● Subscriber growth chart;
● Table of most accessed countries;
● Viewers’ age and gender graph.
Google Ads:
● ROAS – Return on advertising investment.
6. Ad Campaign Units

Another innovation much-awaited by our customers was the possibility of analyzing, individually and more completely, the Facebook Ads and Google Ads campaigns .
For that, it is now possible to insert the campaigns that you want to analyze in a kind of “block.” Then you can click to configure it and add all-important metrics.
In this way, we get only an overview of your ad’s performance and analyze each campaign, which makes it easier to define more specific strategies that best suit your business needs.
7. Export to PDF
Exporting the report to PDF is nothing new. However, in Reportei version 4.0, we were able to make some optimizations that facilitate sharing by this model.
The first change is that you can now export the document as per your purpose. If the objective is to share with your customer via e-mail, the ideal is to choose the option “Share file,” in which there is no page break .
However, if you need to print the report, what will break the pages, but we offer two options to do this: with “Break between networks” so that each media starts on a new page, and “Don’t break between networks,” where one medium starts right after the other ends.
8. Client Area
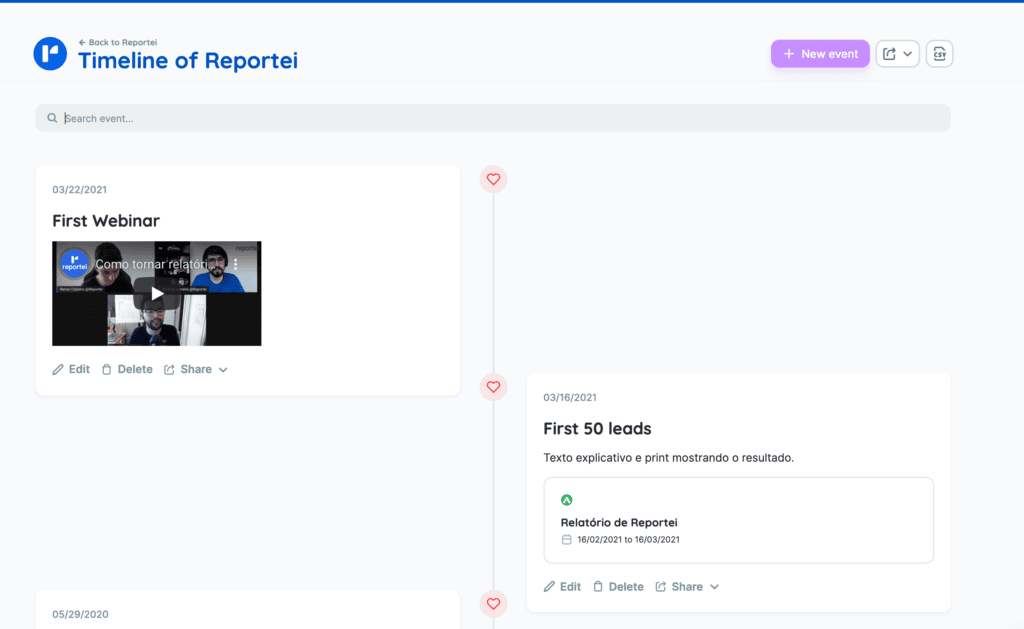
Many people ask us if Reportei has a reserved area for the client. The answer is yes, we do, and you’ve probably heard of it: the Marketing Timeline .
Although not new to Reportei version 4.0, the Timeline gained the new look of the platform and is increasingly standing out as a way to create a project history and use storytelling techniques when reporting to the client all milestones of this partnewhat can fill it inlled in every time a new event happens and shared so that the client can follow the evolution of the results . See some examples:
● “We started a new campaign”;
● “We hit the target!”;
● “Today, we had five new sales.”
9. Automation of reports

Another functionality that was benefited by Reportei version 4.0 was the automation of reports. This option is also new and ready to facilitate your analysis.
For those who don’t know yet, this feature allows you to configure unlimited automations for your reports , without having to follow the generation step by step every month.
Therefore, on the chosen day, you only receive a notification that the report is ready (via Reportei or e-mail) or you can send it directly to your client. Very practical, isn’t it?
How to migrate to Reportei version 4.0?
Ufa! That’s a lot of updates. But it is important to emphasize that all these changes were carefully planned and executed, to ensure the best experience for our customers.
The new version is already available to all users!
