New integration available on Reportei: Analyze your marketing and sales strategies more easily with the HubSpot Marketing and HubSpot CRM report
An amazing update just landed at Reportei: the HubSpot Marketing and HubSpot CRM reports, offering comprehensive metrics to assist in a more precise analysis of your Inbound Marketing and Sales strategies.
Automatically and within seconds, our tool captures all the data and provides the necessary features to facilitate data interpretation, gain insights, and make quicker decisions.
Next, let’s delve into all the details about the two new reports, metrics in each one, charts, and tables. Shall we?
Metrics from HubSpot Marketing
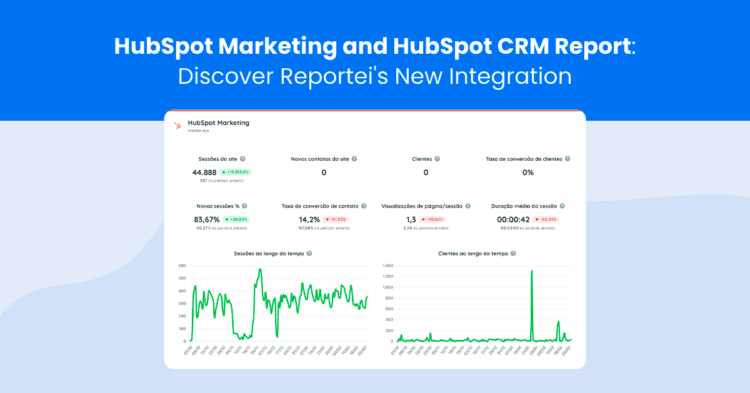
With Reportei’s HubSpot Marketing report, you can analyze comprehensive metrics of your digital marketing efforts. Below are the available data on website visits, lead generation, and email campaigns:
- Website sessions: occurred during the period, which are activities performed by visitors
- New website visitors;
- New site contacts: created during the analysis period;
- Number of Customers: originally converted on the site and are in the lifecycle stage as customers;
- Customer Conversion Rate: with the percentage of visitors reaching the final stage of the sales cycle;
- New sessions (%): percentage of new user sessions;
- Contact Conversion Rate: calculated by dividing the number of contacts by the total number of sessions;
- Page views/session on the site;
- Average exits per page view;
- Website Bounce Rate;
- Average duration of sessions by users;
- Blog views;
- Blog Bounce Rate.
Lead Generation Metrics
After going through an overview of website results and specific tables (which we will present more in detail later), you will also have access to lead generation metrics. They include:
- Landing page views during the analysis period;
- Total form submissions;
- New contacts generated on landing pages;
- Number of CTA displays on screen;
- Entries: total number of people who started filling out the form on the page;
- Exits: people who left the form before submitting it;
- Landing Page Bounce Rate: percentage of users who visited the page but left without taking any action;
- Average time spent on landing page views.
Email Marketing Metrics
Lastly, it’s possible to make a detailed analysis of email marketing campaigns sent to contacts during the period. Here are the available data:
- Emails sent to the lead base;
- Sending rate;
- Emails successfully delivered to leads;
- Number of unique email opens;
- Open rate: percentage of leads who opened the email compared to those who received it;
- Clicks in emails;
- Email click rates: which show the relationship between clicks in content and emails received;
- Click-through rate: which shows the relationship between clicks in the email content and unique opens;
- Delivery rate to recipients compared to emails sent;
- Number of hard bounces: emails that could not be delivered because the address was invalid or the content was marked as spam;
- Hard bounce rate of emails: percentage of emails not delivered compared to those sent;
- Unsubscriptions: users who unsubscribed during the period;
- Unsubscription rate: percentage of users who unsubscribed from your content;
- Spam reports: total emails marked as spam;
- Spam report rate: ratio between content marked as spam and those delivered to recipients.
Charts
Along with all these metrics, the HubSpot Marketing report also provides comparative charts to help you understand data such as:
- Customer acquisition over time;
- Contact by type: number of new and existing contacts who submitted forms;
- Sessions over time;
- Views by device.
An interesting detail is that, in addition to analyzing the charts based on the selected period for the report, you can now also view data grouped by weeks, months, or quarters, which aids in tracking performance indicators over time.
Tables
Finally, we have tables for specific analyses of the results of your marketing efforts. Here are the available tables:
- Session origins, presenting key metrics according to the channels driving traffic to the site;
- Highlighted countries in website access;
- UTM parameters, allowing for data analysis using the UTM parameters in the URLs visitors use to access the site;
- Highlighted blog posts;
- Top pages: with a summary of the HubSpot page performance during the period;
- Form summary;
- Submissions by source, with views, submissions, and conversion rates by session origin when the form was submitted;
- Highlighted emails, emphasizing the key metrics for delivery, opens, and clicks.
In summary, by combining all these data points, you can get a comprehensive view of your Inbound Marketing strategies in HubSpot, covering the top, middle, and bottom of the funnel.
HubSpot CRM Metrics
Beyond marketing reports, Reportei also aids in streamlining and making HubSpot CRM analyses more precise. Below are the available metrics:
- New deals created during the defined period in the report;
- Closed deals;
- Deal closure rate, showing the ratio between opened and closed deals;
- Average total value of closed deals;
- Lost deals;
- Lost deal rate, calculated relative to the deals opened in the period;
- Total revenue from all closed deals;
- Contacts created in the HubSpot CRM account;
- Contacts assigned to an owner during the period;
- Worked contacts that had sales activities logged;
- Unworked contacts, meaning those without logged activities in the period;
- Completed calls;
- Average call duration;
- Completed tasks;
- Uninitiated tasks;
- Emails sent to contacts;
- Sales funnel, with the number of deals at each stage;
- Pipelines.
Similar to the Marketing report, these metrics can be analyzed both generally and specifically, using charts and tables.
Charts
The charts in the report offer the possibility of performing different comparisons among the results. Among them are:
- Deals over time;
- Closed and lost deals;
- Business revenue by source, such as organic search, paid, email, offline, etc.;
- Total closed transactions relative to the goal.
Should you prefer, you can also manually add charts and metrics to supplement the information automatically captured by Reportei and make your analyses even more in-depth.
Tables
The tables offer the following specific analysis possibilities regarding your sales strategies:
- Activities by representative, such as calls and emails sent by each;
- Reasons for lost deals;
- Deals closed by each of the owners;
- Summary of activities logged by representatives during the period.
Thus, you have the ability to understand who the most active representatives are and how to work to avoid future lost business opportunities.
Customize Your HubSpot Marketing and HubSpot CRM Reports
After getting to know the metrics, charts, and tables available in Reportei’s HubSpot reports, it’s important to note that the tool goes beyond automatic data capture.
With our features, you can customize your reports and dashboards by adding your analyses of the results—in text, images, or videos—reorder the information to highlight what is most relevant, and define the order in which channels will be presented to the client. You can even create an inverted funnel to log each stage of the sales process.
Moreover, you can utilize our new Marketing Funnel feature to provide a more integrated view of HubSpot Marketing and HubSpot CRM metrics. This aids both in presenting data to the client and in gaining insights for each stage of the funnel.
HubSpot reports are only available on the Premium plan, but you can test the functionalities for free on our platform!