Now you can create a cover for custom reports in Reportei, with data and themes to fit your client.
We’ve updated Reportei to help you create custom reports! Now you can add and design covers to fit your client’s needs precisely.
Align reports with the client’s visual identity in minutes, and save your templates for later. Here’s a how-to. Check it out!
How to add a cover to reports in Reportei
As you know, our tool is packed with features that help you create reports that are just right for your clients. You can reorder or add metrics, order channels according to the sales funnel, and include your data analysis and considerations about results.
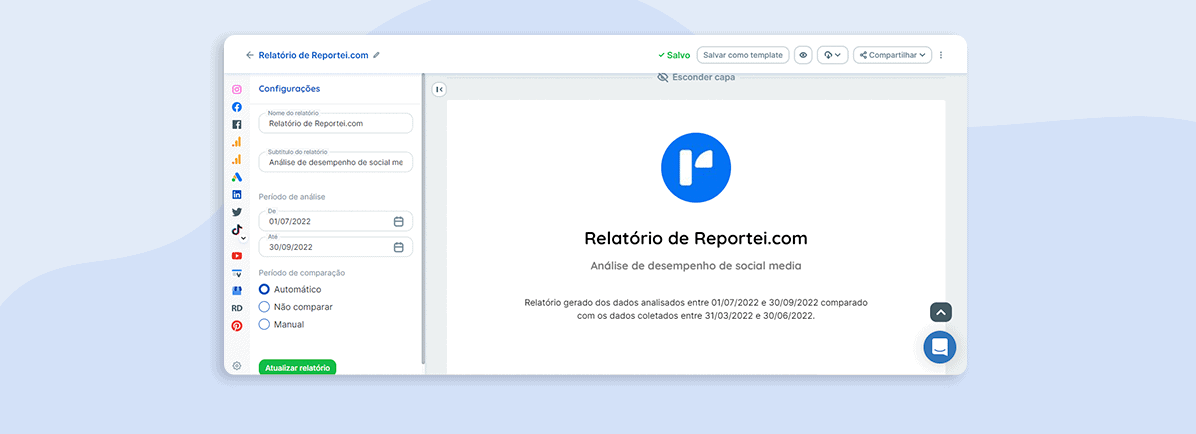
Now you can customize report covers with a few simple steps. Tap the “Header Settings” button in the upper right corner of a report.
Next, you’ll see a list of options on the left where you can customize templates, text, logos, and themes.
Models and text
One option for custom report covers is choosing your template and text style for a header. You can also:
- Design headers as covers, and make them A4 for printing if that’s how you present results to clients;
- Unlink your title and subtitles from the report name. Then, you can customize each of them according to priority.
- Show analysis periods so you can decide whether you want that data in your report.
Logos
The second field lets you choose whether to place your company logo on the cover of your report and format it how you like.
For example, you can choose a custom shape (round, square, or rectangular) or add a custom logo created by your designer.
Themes
Last, you can change your report header theme using your client’s branding colors. Then, you can change the cover background colors, title and subtitle colors, and analysis periods.
And that’s it! Changes are saved in your report automatically.
A few other ways of customizing reports
As we said earlier, there are other ways to customize reports to fit your client’s or decision-makers’ needs. Here are some things you can do and how to save templates for future use
Adding analysis
The earliest versions of Reportei already included the option of adding open analyses to reports, with detailed interpretation of metrics results and the next steps of the project.
Besides adding texts, you can complement reports by adding your analysis as images or a video. By the way, we have an article with 4 tips for analyzing digital marketing reports more efficiently. It’s worth checking out.
Manual metrics and graphs
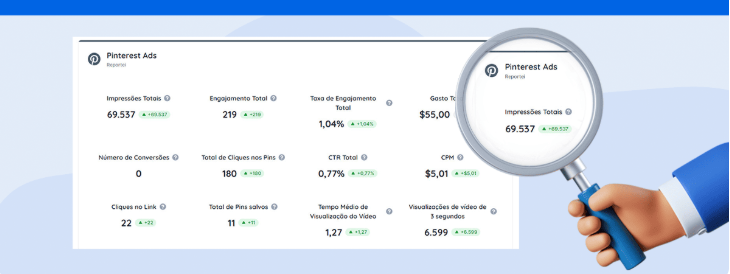
Another Reportei update is that you can manually add metrics and charts to reports if you notice any relevant data missing from our automatic data capture.
All you have to do is click Add metrics, which will give you access to manual data entry, whether you’ll be comparing data, and your preferred graph format.
Ordering metrics and channels
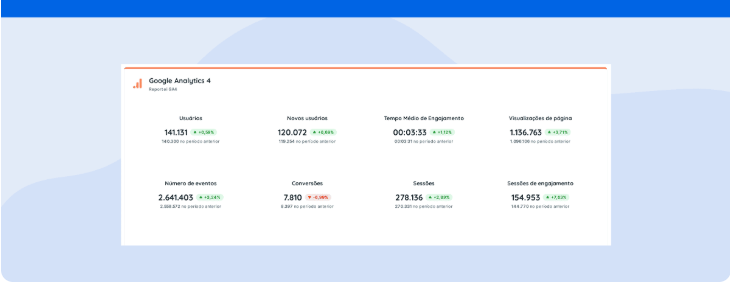
Besides adding metrics manually, you can also remove or reorder other data captured automatically by our integrations.
You can also reorder customer channels and create your own funnels. Or, if you’d like, you can choose from one of our templates. They are: default (where social networks are highlighted), inbound (which generates your inverted funnel), and paid traffic (focused on paid media channels).
How to save report templates
Finally, you can save your custom reports for later, so you don’t have to keep creating reports from scratch every month.
Here’s a quick list of the steps you can take to make reporting more efficient:
- In the top menu, tap Save as a template;
- Choose a title that will clearly identify the layout;
- Click to save, and there you go! You can now reuse your template anytime.
Your client’s custom report will be shown alongside standard Reportei templates and an available option for any project.
Let our handy resources help you create custom reports right now! Do everything your way and design covers and metrics, and analysis formats!


