Conheça as métricas PMax mais relevantes, como analisá-las e boas práticas para adotar nas suas campanhas do Google
As métricas PMax são o ponto de partida para entender, com clareza, quais resultados suas campanhas de Performance Max do Google entregam e como evoluir de forma consistente.
Sendo assim, preparamos este guia para mostrar como ler esses dados sem complicação, entender quais são os mais importantes e como transformá-los em decisões no dia a dia. Acompanhe a seguir!
O que são campanhas PMax no Google?
Mas antes de tudo, é essencial entender o que são as campanhas PMax e como elas funcionam.
Orientadas aos objetivos do negócio, elas usam sinais de audiência para encontrar as melhores oportunidades de conversão em todo o inventário do Google.
Dessa forma, na prática, esse modelo é um complemento às campanhas por palavra-chave.
Isto é, enquanto a rede de pesquisa captura a demanda explícita, a PMax expande o alcance e busca conversões onde a intenção aparece de forma implícita – como vídeos assistidos, navegação, recomendações, entre outros.
Assim, podemos ver que as campanhas de Performance Max oferecem uma série de vantagens aos profissionais de marketing, como:
- Cobertura ampla sem duplicar setups por canal;
- Otimização automática de lance, orçamento e criativos;
- Aproveitamento de dados próprios, afinal listas de clientes/assinantes alimentam a IA com sinais de alta qualidade;
- Aprendizado contínuo, uma vez que a campanha se ajusta conforme recebe feedback de conversão.
Inclusive, podemos ver esses benefícios com mais clareza quando comparamos a PMax com campanhas manuais:
| Aspecto | PMax | Campanhas manuais (Search / Display / YouTube) |
| Distribuição | Multicanais com IA | Canal a canal |
| Configuração | Única campanha com grupos de ativos | Vários formatos e conjuntos de anúncios |
| Otimização | Lances/segmentação/criativos automatizados | Lances e segmentação definidos manualmente |
| Escala | Rápida e orientada ao objetivo | Controlada pelo anunciante e com expansão gradual |
| Leitura | Mais agregada e com foco em valor | Granular por termo/posicionamento |
Ou seja, a PMax é um complemento inteligente ao Search, já que pode ampliar alcance e capturar mais conversões com menos atritos no operacional.
No entanto, o sucesso desse modelo de campanha depende de boas configurações e de uma leitura consistente dos resultados, como veremos com mais detalhes a seguir.
Importância de acompanhar as métricas PMax
Como as campanhas PMax consolidam canais e decisões de forma automática, ler as métricas certas ajuda a evitar a sensação de “estar no escuro” em relação à eficiência dos anúncios.
Mas para fazer essa leitura da forma correta, o segredo é ligar cada indicador ao objetivo de negócio – como gerar vendas ou leads qualificados – e criar um ritmo de análise:
- checagens rápidas diárias para conferir status de campanhas e ritmo;
- leitura tática semanal, que ajuda a conferir a eficiência e os criativos;
- e revisão estratégica mensal, de forma a entender se a PMax é lucrativa e planejar novos ciclos.
Métricas PMax: quais acompanhar?
Agora que você já sabe como funciona esse modelo de campanha no Google Ads, é hora de conhecer as métricas PMax mais relevantes e como analisá-las. Vamos lá?
1. Conversões
Para começar, as conversões apresentam o volume de resultados que a campanha entrega segundo a sua configuração – como compras, leads qualificados, cadastros, entre outras ações relevantes para o negócio.
Dessa forma, ela é o indicador central do objetivo e deve ser analisada com muito cuidado.
Isto é, além de verificar o número total de conversões, é essencial conferir a taxa de conversão e a janela de tempo entre a interação do usuário e a realização de uma ação.
Caso o volume caia após mudanças na campanha, dê tempo para a inteligência artificial do Google se reequilibrar (cerca de uma a duas semanas) antes de tomar novas decisões.
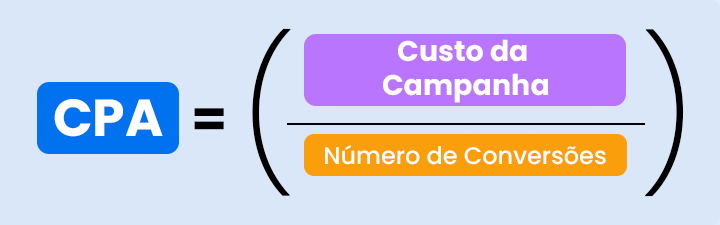
2. CPA (Custo por Aquisição)
Enquanto isso, o CPA mostra quanto você paga por cada conversão.
Ou seja, ele é importante por traduzir a eficiência do investimento para adquirir novas vendas, leads qualificados, entre outros resultados relacionados ao objetivo da campanha.
Dito isso, se o CPA subir, é preciso verificar se houve queda da taxa de conversão no site ou se CTR/CPC pioraram – devido a tráfego menos qualificado ou criativos fracos, por exemplo.
Inclusive, a leitura por grupos de ativos ajuda a identificar onde agir.
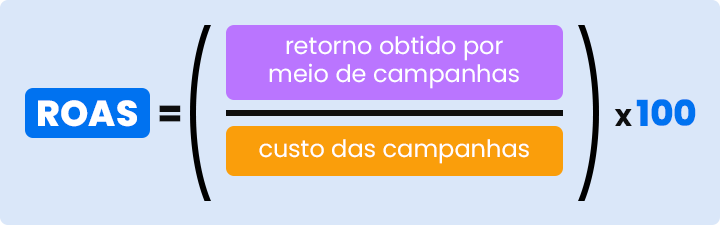
3. ROAS (Retorno sobre investimento em anúncios)
O ROAS é o que conecta a mídia ao resultado financeiro. Desse modo, é uma das métricas PMax mais relevantes para compreender o que realmente funciona dentro da sua campanha.
Por isso, sempre compare ROAS por período, grupos de ativos e categoria de produto/serviço.
Com isso, você saberá onde vale mais a pena investir seu dinheiro e poderá realizar otimizações que ajudem a IA do Google a trabalhar com mais eficiência.
Veja como é calculado o retorno sobre investimento em anúncios:
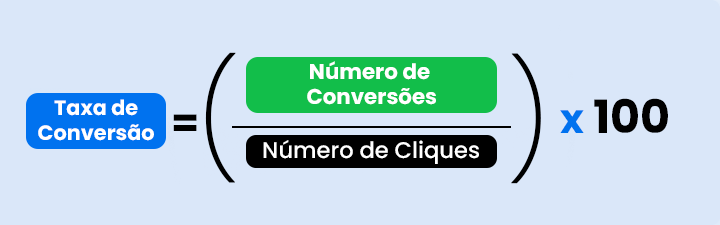
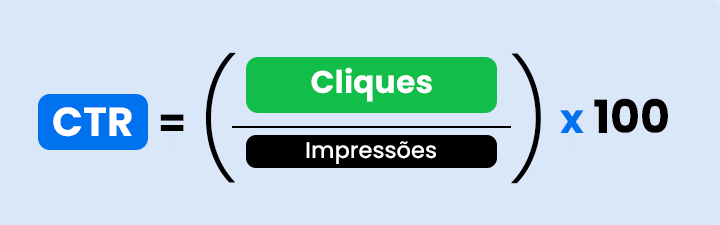
4. CTR (Taxa de Cliques)
Já o CTR traz a proporção de cliques sobre impressões, sinalizando o nível de atração do criativo e adequação da mensagem ao público.
Pensando nisso, um CTR baixo com muitas impressões pode indicar desalinhamento de proposta de valor.
Assim, é preciso revisar todos os elementos que incentivam o tráfego de qualidade, como títulos, imagens e chamadas de ação, sempre priorizando benefícios e aspectos reais do seu produto ou serviço.
5. Impressões e alcance
Consideradas topo de funil, essas duas métricas ajudam a entender se o orçamento está ganhando escala e onde a campanha está sendo entregue.
Mas muito além de ver esses números de forma isolada, é importante relacioná-los à qualidade do tráfego – analisando em conjunto com o CTR, por exemplo – para não focar em um alcance vazio.
6. Taxa de engajamento no YouTube e Display
A taxa de engajamento inclui métricas PMax como visualizações, taxa de visualização e interações com anúncios de vídeo e rede de display.
Com isso, ela é um bom indicativo de criativos relevantes no topo do funil.
Ou seja, se houver muito alcance e pouco resultado de interações, é possível reforçar provas de valor nos criativos – ofertas, diferenciais e urgência – e validar as segmentações de públicos.
7. Segmentos de audiência e insights de pesquisa
Juntamente com isso, relatórios de públicos – com características, interesses e comportamentos – e temas de pesquisa mostram onde a campanha encontra intenção.
Dessa forma, ajudam a orientar a expansão qualificada e reduzir canibalização de marca quando você já tem campanhas de rede de pesquisa e de brand.
Isto é, esses dados ajudam a alimentar a IA e a evitar uma competição interna que diminua a eficiência das suas estratégias no Google Ads.
Boas práticas para aumentar a eficiência das campanhas PMax
Para a PMax entregar tudo o que promete, não basta apenas colocar a campanha no ar.
É preciso orientar a automação com dados confiáveis, estrutura coerente e um ritmo de testes que gere aprendizado real.
Por isso, selecionamos abaixo as melhores práticas para garantir campanhas mais eficientes no Google. Confira:
- Defina conversões de valor (compra/lead qualificado) e valide a mensuração entre Ads e Google Analytics 4. Afinal, sem bons dados para avaliar, a IA pode se perder;
- Estruture grupos de ativos por linha de produto/ICP (perfil de cliente ideal), de forma a melhorar a qualidade do tráfego e a leitura de resultados;
- Alimente a IA com dados próprios, como listas de clientes e assinantes;
- Teste metas e criativos aos poucos: uma variável por vez e com avaliação de uma a duas semanas;
- Cuide do feed no Google Shopping, atualizando com títulos claros, imagens adequadas e descrições que ajudem a incentivar as vendas.
Quando você combina mensuração confiável e boas práticas para veiculação de anúncios, a PMAX passa a ser uma máquina de aprendizado a seu favor.
Como resultado, a campanha ganha escala com eficiência e, principalmente, conecta mídia ao que realmente impacta o negócio.
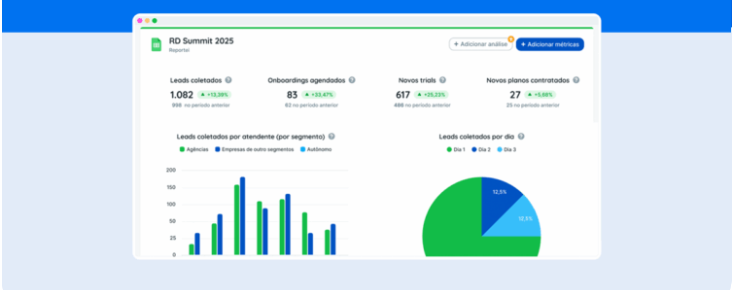
Como analisar as métricas PMax com o Reportei
Sem dúvidas, um dashboard bem montado também acelera a tomada de decisão quando falamos de campanhas no Google.
Por isso, recentemente, subimos no Reportei as métricas de PMax!
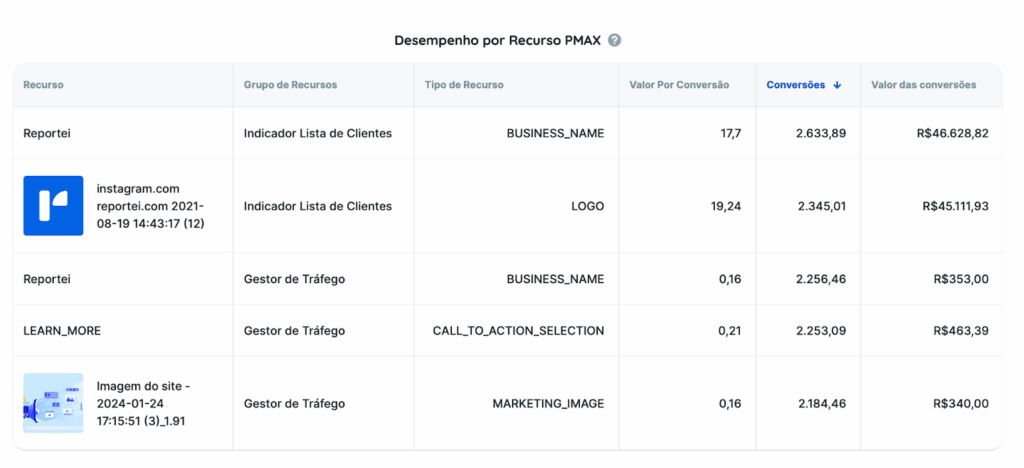
Ou seja, além de tudo que o relatório já oferecia, agora você pode incluir mais três tabelas que organizam dados de conversões, valor de conversão, impressões, CTR, custo e mais — tudo pronto para leitura prática. São elas:
- Desempenho por Grupo de recurso PMax: com visão por grupo de ativos, o que ajuda a comparar linhas de produto/serviço.
- Desempenho por localização PMax: que proporciona uma leitura geográfica para encontrar mercados mais eficientes e orientar ajustes regionais.
- Desempenho por recurso PMax: avaliação de recursos – títulos imagens e vídeos – para priorizar substituições e novos testes.
Atualmente, essas tabelas podem ser adicionadas manualmente aos seus relatórios e dashboards. Porém, em breve, também estarão disponíveis nos templates padrão do Reportei.
Aproveite para testar agora mesmo essa novidade e extrair os melhores insights para a sua campanha PMax!
FAQ: dúvidas frequentes sobre campanhas e métricas PMax
A seguir, confira as respostas para as dúvidas que mais surgem quando falamos de Performance Max e análise desse modelo de campanha:
Não, mas a PMax complementa o Search. Mantenha brand e termos estratégicos com campanhas próprias e use PMax para escalar além da busca.
Após ajustes relevantes (como meta, orçamento e objetivo), aguarde uma a duas semanas para a campanha estabilizar e compare períodos equivalentes.
Não necessariamente, mas ajuda muito. Afinal, vídeos liberam inventários como YouTube e melhoram a leitura de intenção. Eles podem ser simples, desde que deixem claro o benefício.
Prefira grupos coerentes por linha de produto/ICP. Muitos grupos com pouco volume fragmentam o aprendizado. No entanto, poucos grupos podem misturar intenções.
Importe listas de clientes/assinantes e crie sinais de público. A IA encontra perfis semelhantes com maior chance de converter.
Diariamente, o ideal é acompanhar gastos, impressões, status e reprovações. Na avaliação semanal, analise ROAS/CPA, CTR, criativos e cortes por grupos de ativos e região.
Por fim, é importante monitorar mensalmente a lucratividade gerada pela campanha e definir novas estratégias a partir de seu desempenho geral.