Check out the complete guide to Google Analytics 4 and how website and app analyses are now structured.
After an extended implementation period, Google Analytics 4 has finally become the official version for analyzing website and app data, definitively replacing Universal Analytics. As it brings several significant changes compared to the previous version of the tool, analysts need to adapt to the new way of capturing data, available reports, and how to use insights to enhance their digital strategies. Therefore, we’ve prepared this guide to explain the key functionalities and what changes are in store compared to UA. Continue reading to explore the details!
Key Changes in GA4 Compared to Universal Analytics
To start, it’s essential to discuss the advancements Google Analytics 4 brings in comparison to Universal Analytics. The new platform version focuses on capturing data and generating reports in a more advanced, precise, and intelligent manner.
1. Event-driven Data Model
Undoubtedly, one of the significant differences between GA4 and UA is data capture, which emphasizes measuring events performed on websites or apps. Previously, the tool centered around user sessions but didn’t delve as deeply into interactions on pages. Now, improvements have been made in tracking technology to gather specific information about visitor actions, such as button clicks, page views, form submissions, file downloads, and more. This leads to a more accurate measurement of the consumer journey, considering all their online steps—whether on the website or application. However, there’s also another point of attention: since GA4 has fewer preconfigured native events, the initial effort is required to set up the most important interactions for your business, organize them, and then be able to track them.
2. AI and Machine Learning Enhancements
Alongside changes in event tracking, Google Analytics 4 has also optimized its machine learning process and utilizes artificial intelligence (AI) to enhance data analysis. With this, the platform detects patterns in user behavior, provides more valuable insights, and assists analysts in improving user experiences on their websites or apps.
3. Increased Privacy Concerns
Furthermore, one of the main motivations for GA4 changes in event monitoring is associated with data protection laws, which are gaining more prominence worldwide. Consequently, the tool has been adapted to prioritize data control and provide more care regarding this sensitive topic, which is currently crucial and demands the full attention of professionals working in digital marketing.
4. New Dashboards
Another intriguing advancement of Google Analytics 4 is the availability of new dashboards on the platform, which focus on providing customized reports tailored to each business type’s needs. Initially, this change might seem a bit unfamiliar, especially when compared to UA. However, you’ll later realize that these dashboards not only offer a simpler and project-adapted visualization but also make customization easier.
5. Insights
Lastly, we cannot neglect the role of insights, which have gained more significance in GA4. Now, the platform not only captures data but also assists in more precise analyses and making more informed decisions for your website or app. In fact, you can guide the tool regarding the insights you desire, ask questions about audience and traffic data, turning it into a consultative platform for analysts.
Inside Google Analytics 4
Now that you’re familiar with the key changes that have come to GA4, it’s worth understanding how the four tabs available on the platform work—Home, Reports, Explore, and Advertising—and how they contribute to more accurate data analysis.
Home
The Home tab of Google Analytics 4 provides an overview of site or app data, featuring key metrics about access, interactions on pages, and audience information. As mentioned earlier, these panels are customized based on each account’s needs. Additionally, this tab displays the primary insights you require to make more informed decisions in your routine.
Reports
The Reports tab is one of the most crucial aspects of GA4 and is heavily used by digital marketing professionals in their daily activities. Within this space, you’ll find a summary of results, real-time data, and the Lifecycle (based on sales funnel stages), which is divided into four report types:
- 1. Acquisition: Focuses on traffic performance and user attraction to the site or app;
- 2. Engagement: Details user interaction events on the page (views, conversions, and other visitor activities);
- 3. Monetization: Presents revenue and sales data for e-commerce or app, considering revenue from advertising;
- 4. Retention: Assists in analyzing how many users are returning to the site and the effectiveness of the retention process, along with metrics like user lifetime value (LTV) and other relevant data.
It’s noteworthy that these reports work with a new and significant metric: engaged sessions, helping measure user interactions, pages generating more engagement, and providing insights to increase visitor event participation.
Explore
Speaking of insights, the Explore tab was developed to offer advanced techniques and insights into user behavior on the site and customers. Google Analytics 4 utilizes machine learning to deliver predictive metrics about your audience and assist in enhancing site strategies. Another positive aspect is the ability to use filters and segments to prioritize essential information, create and save target audiences within the tool, and export this data to leverage other channels.
Advertising
Given its enhanced integration with Google Ads, GA4 features a dedicated Advertising tab, aimed at helping marketing professionals understand media ROI and make better decisions. To achieve this, Advertising reports are divided into three parts:
- 1. Advertising Summary: Provides an overview of results, such as conversion performance, top-converting channels, and the performance of the best ads;
- 2. Model Comparison: Assists in evaluating how attribution models influence results for each of the channels used in the marketing strategy;
- 3. Conversion Paths: Displays the paths your customers take to conversion, detailing channels, revenue, days to conversion, and touchpoints throughout the process.
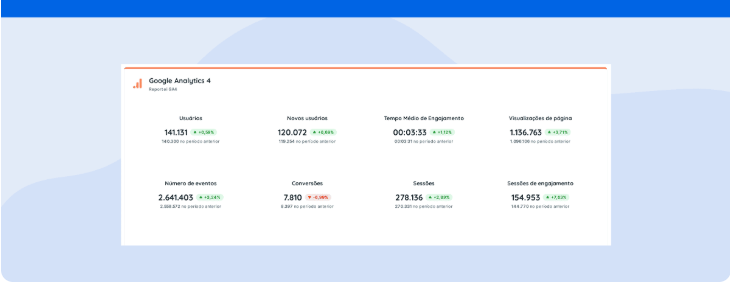
Universal Analytics and GA4 Reporting in Reportei
For those using Reportei to generate Universal Analytics reports, it’s worth noting that the captured data will continue to be saved normally on our platform. In other words, you won’t lose any previously generated reports and can access the information whenever you need. Additionally, integration with Google Analytics 4 is available in Reportei, enabling you to create even more practical and swift reports about site or app traffic, access sources, key events, conversions, and much more! Similar to the platform, you can customize which metrics you wish to view, select data to appear in the document and save the template for reuse in the same or different projects. Access your account or try out our tool for free to closely explore all the features and generate your Google Analytics 4 reports with greater ease!


