Learn how to edit graphs and tables for custom reports in Reportei
Reportei 4.0 has a few new options for custom reports and a more comprehensive, intuitive user experience. Something worth mentioning is that you can edit graphs and tables, modifying anything from designs to listed metrics.
Here’s what you need to know about these new features and how to edit graphs and tables for your projects. Check it out in the article below!
Custom Reports in Reportei
One of the advantages of using Reportei version 3 (continued in version 4) is the range of options for editing reports. You can:
- Insert, remove, or reposition metrics for different media;
- Establish viewing order of channels;
- Change titles, dates, and comparison periods as needed;
- Add open analysis in text, image, or video;
- Add/edit graphs and tables for better understanding (of decision-makers).
Today’s article is about that last item. We’ll show you how to edit designs and metrics in graphs and tables to keep the rest of your team and clients up to speed.
How to edit graphs in Reportei
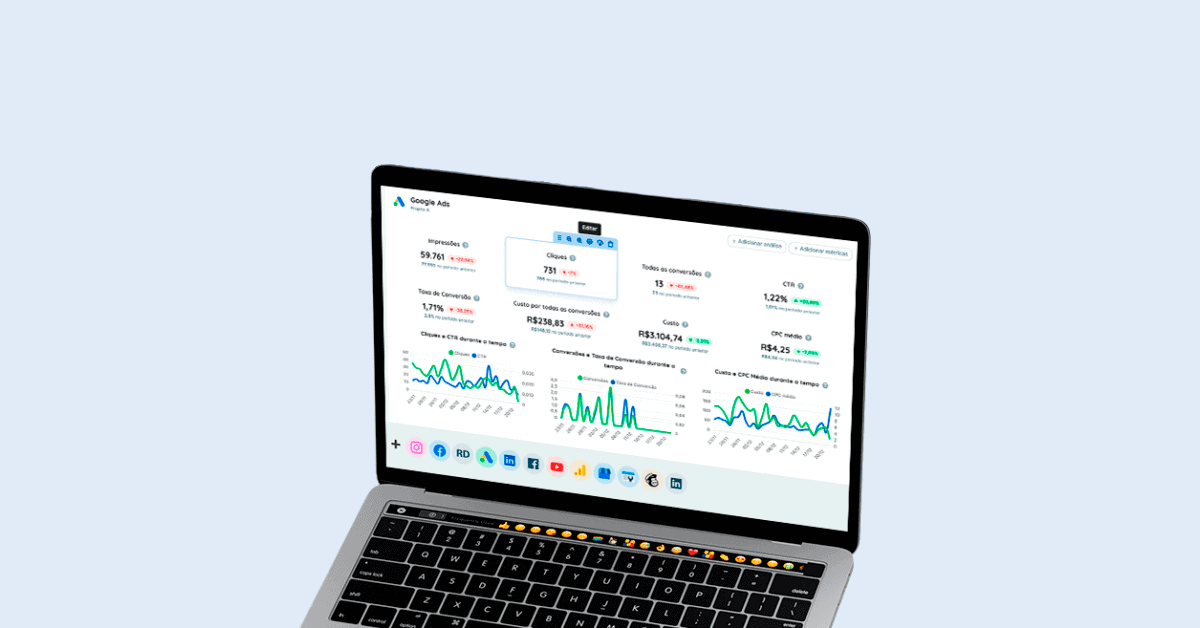
To edit a graph, select a channel first. Next, choose a graph and click the gear icon in the upper right corner. A tab with options will be displayed on the left
At the top, you’ll see options for changing graph titles and descriptions that show up behind the question icon. That will make the data easier for your clients to interpret.
You can also select the type of graph, and several social media for data analysis of:
- Series: these are the metrics available for charts. Select more than one to compare;
- Dimension: aspects of the chart (gender, city, country, origin, etc.) for analysis. You can add several charts per aspect.
Types of graphs
Choose from pie charts, line charts, or bar charts.
Reportei will suggest the most suitable type, but you can edit them whenever to make visualization and interpreting simple.
How to edit tables in Reportei
Editing tables in Reportei is pretty much the same as editing graphs. First, click the gear icon to open the left-side tab. Edit the title and description.
Next, establish the number of lines for your table and order of importance (ascending or descending order).
You can also include bars, rows, and value filters
Bars
Click on the bar tab to choose metrics to view or hide for each table. You can give your client an overview or opt to display only the most relevant data.
You can show or hide any aspect in the table in Lines. Select the info you’d like to see, and the respective data will be displayed.
Filtering values
Here’s where to select a bar to add a filter. Choose the type of filter you’d like to use and a value for data you’d like to see.
Save charts and graphs for future reports
You can edit or save templates and reuse them anytime for any of your clients. To do that, click Save as a Template at the top right of your report.
Next, add a title. Tap Save. You can opt for a saved template whenever you need to add a new report, regardless of the clients connected to your account.
Did you like this tutorial to help you edit graphs and tables? Log into your Reportei account now to find out how we can help make your marketing analysis more practical and strategic!