Get a first-hand look at what Reportei’s custom blocks are and how to add them to your report or dashboard
To make your reports and dashboards even more strategic, Reportei has launched custom blocks: a new feature that allows you to create a summary with the main metrics of the channels, creating a quicker and more practical visualization of the overall project results.
Want to know the details and how this new feature of our tool works?
Below, we present all the information and show you how to add a block to your report. Follow along!
What Are Reportei’s Custom Blocks?
Reportei’s custom blocks are a space in the report or dashboard designated for creating a strategic and visual summary of your digital marketing results, where you can list the main results of the most relevant media of the project.
Or, if you prefer, it’s possible to create a report for a network that is not yet integrated with our tool, such as WhatsApp – which helps to make the document even more valuable for your meetings with clients/decision-makers.
The great advantage of using this feature is to keep all the most important information in the same layout, which helps maintain the harmony of the custom blocks with the other integrated channels and makes data interpretation simpler for the reader.
For this, the customization of this space allows:
Inserting metrics from different integrations into a single block; Adding manual metrics and analyses; Creating calculated metrics with different integrations, i.e., developing formulas and calculations with data from different networks; Grouping data, adding up the same metric from different networks; Creating marketing funnels and graphs with metrics from different integrations.
Currently, the first step available in the custom block is to add manual metrics and analyses. However, the other actions will also be usable soon, which will make the functionality more complete for your routine of creating reports.
How Do Custom Blocks Work?
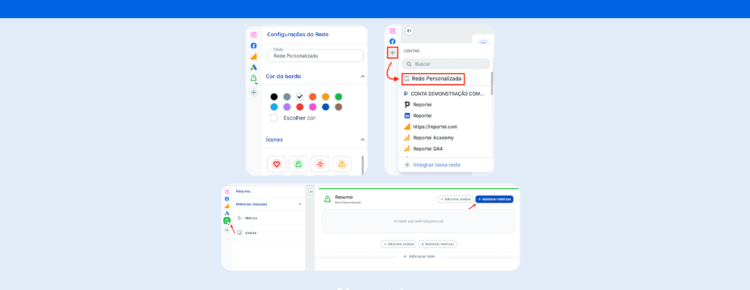
Adding custom blocks to your reports and dashboards is much simpler than you might think! The first step is, when creating the document, to click on the “Add new network” option in the control bar (left side) or the “Add network” option, available in the middle of the report.
After that, you’ll have access to the configuration stage of the “channel,” where you can change the title, subtitle, border color (to distinguish it from other channels), and the icon that will represent your summary or manual integration.
After clicking on “Add,” you’ll have access to the same structure as the other channels, but with an empty space to select which metrics are truly relevant for this summary. When selecting the “Add metrics” option, the control bar will show all available data options to start customization.
As we mentioned earlier, only manual metrics and analyses (in text, image, or video) can be chosen at the moment. However, in the future, you will be able to add metrics from other networks to compose your custom block.
As it behaves like a “network block,” this feature can also be removed or reordered according to the needs of your report or dashboard.
Moreover, you can add as many blocks as you want throughout the document and save the template to use again as many times as you want, in the same or other projects.
See Other Customization Tips for Your Reports
Reportei’s custom blocks are just one of the ways to customize your reports and dashboards to make analysis more practical in the routine and data presentation more efficient for clients.
But our tool doesn’t stop there, as there are other features that adapt to the needs of your projects. Check out what are the main ones:
Changing the Layout of Metrics
Whether to add, delete, or change the way data is presented in the document, Reportei gives you complete freedom to decide what is most relevant for your report and for the client’s understanding during the results presentation meeting.
Swapping the Order of Channels
Another point that can be modified is the order of the integrated social media channels, so that the most important ones appear first. In addition, if you use a custom block as a summary of the results, you can place it at the top of the document, to be the first topic addressed with the client.
If you are still unsure about creating the best order for your project, you can also use our templates for paid traffic, inbound marketing, e-commerce, or digital marketing specialists as a basis, which help develop the best report according to your goals.
Marketing Funnel
A feature that can be used to customize and enrich your report, the marketing funnel allows for a more strategic analysis of the networks and the impact they have from attracting the audience to converting customers. This tool can be added to all reports of the integrated channels, which helps to have a clearer view of the results and potential gaps in the funnel.
Grouping Data in Graphs
For those looking for longer period analyses with graphs, it’s possible to use data grouping to make a comparison by week, month, or quarter, ensuring a visualization that considers the evolution of the project. For social networks, for example, you can see the growth of followers over time. Meanwhile, in paid traffic, you can compare the amounts invested each month.
Saved Templates
Finally, it’s worth highlighting that all the templates you customize in Reportei can be saved for later use, within the same project or in other client accounts. In other words, the work of creating the ideal layout with custom blocks, metrics, graphs, and analyses is done just once. After that, just choose the saved template and perform analyses in a much more strategic way.
Liked learning about the custom blocks and customization options present in Reportei? Then don’t hesitate to test the tool now in creating your reports!


