Check out the new Ads metrics that have arrived in the Meta, Google, LinkedIn, TikTok, and Pinterest reports.
In paid traffic, monitoring campaign performance is essential to optimize them and achieve the best results. With Reportei, this task becomes even more efficient, especially with the new Ads metrics that have arrived in our reports.
With them, you now have an even more comprehensive view of data from platforms like Meta Ads, Google Ads, LinkedIn Ads, TikTok Ads, and Pinterest Ads.
Therefore, we have prepared this article to show how these updates in Reportei can transform the way you monitor and adjust your ad strategies, ensuring that every decision is based on accurate and relevant data. Follow below.
Check out the new Ads metrics that have arrived in Reportei.
With the new Ads metrics recently integrated into Reportei, ad campaign analyses have become even more detailed and strategic.
They are not available in the standard templates, but to view them, just click on the Add new metric button inside the report and look for the data highlighted as New.
Next, we also highlight the main additions in the Google, LinkedIn, TikTok, Pinterest, and Meta reports to help identify relevant information for your analyses. Check it out.
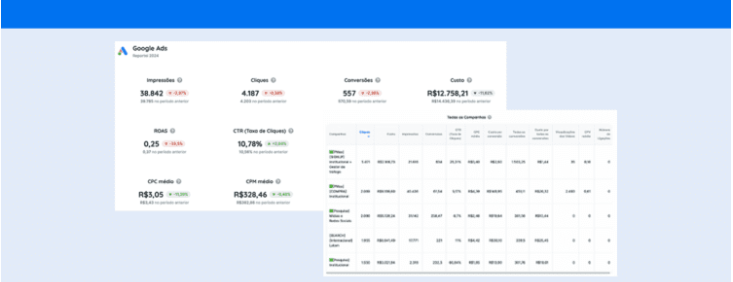
Google Ads
The new metrics of Google Ads focus on more specific analysis of interactions performed by users impacted by the ads. In other words, you can capture data like
- Conversions, Engagement which shows the number of times a person engaged with your ad after interacting with it.
- Quotation Requests essential for B2B businesses or for products and services with higher added value.
- Start Checkout and Purchases are crucial for e-commerce since they help track the customer’s journey from initial interest to completing the sale.
There is also the possibility of analyzing the number of interactions obtained in addition to metrics related to registrations made on the website, downloads, lead conversions, and even sales in physical stores.
In addition to these data, Reportei also introduced tables that allow performance tracking of campaigns by location. Now it is possible to view performance by state, city, metropolitan area, and even by postal code.
This information is extremely useful for ads with geographic targeting, allowing fine adjustments to maximize ad impact in different regions.
LinkedIn Ads
The new Ads metrics of LinkedIn integrated into Reportei offer an additional layer of analysis to optimize B2B marketing and recruitment strategies.
This makes it possible to view more complete information about job applications that came through your ads. to understand what paths these users followed and how they interacted with the company.
This helps to better understand candidate behavior and adjust ad targeting and messaging to maximize return.
Along with this, there is now also the possibility to analyze viral metrics like Viral Engagements and Viral Reactions, Document Views, Registrations, and others.
Finally, new performance tables have also arrived, providing a detailed view of positions, companies, regions, industry sector, and more.
TikTok Ads
With the new metrics of TikTok Ads now available in Reportei, marketers have access to even more detailed insights into the behavior of iOS device users.
Among the available data are the iOS Conversion Rate, iOS Purchase ROAS, iOS Cost per Add to Cart, iOS CPA, iOS Lead Generation Rate, among many others.
With this, it is possible to optimize your campaigns in a more precise and targeted way for iPhone users, who are a strategic audience for many brands.
Pinterest Ads
The report of Pinterest Ads now features new charts and tables to analyze your ad metrics in more detail. Among them, we can highlight
- Clicks and CTR over time allows continuous monitoring of the evolution of the number of clicks on your ads and the click-through rate (CTR).
- CPM and Impressions over time shows the relationship between how many times the ads were displayed and what was the cost per thousand impressions (CPM).
- Expenses over time is valuable for precise tracking of campaign costs, helping in budget control.
- Featured Ad Group and Featured Ads that help campaign managers focus their efforts on elements that bring the highest return and adjust or deactivate those with low performance.
- Keywords are crucial for search-oriented campaigns within Pinterest.
Meta Ads
Finally, the Meta report brings the following new Ads metrics
- Cost per Videos with 25, 50, 75, and 95% Viewed allowing evaluation not only of initial engagement but also the level of audience interest and retention at different stages of video viewing.
- ROAS Facebook and ROAS Instagram the Return on Ad Spend is critical for understanding the financial effectiveness of campaigns. By separating ROAS by platform, advertisers can directly compare the performance of their ads on Facebook versus Instagram.
- Conversion Value of Add to Cart and Conversion Value of Initiated Checkout Completions provide detailed insights into the audience’s purchasing behavior.
With these Meta Ads metrics, advertisers can make precise adjustments to improve campaign performance both in terms of engagement and financial return.
Monitor your project’s Ads metrics more quickly.
In addition to having access to even more complete paid traffic reports, you can now also monitor Ads metrics quickly with Reportei Overview.
This is because this feature allows you to track in real-time all the campaign data of your projects in a single customized dashboard. Moreover, you can set goals for these indicators to quickly understand whether your ads are on the right track.
In other words, the Overview facilitates comparative analysis, strategic decision-making, and helps optimize your campaigns efficiently. Log in to your account now to test this feature.