Learn how to generate a Threads report through Reportei and discover the metrics automatically captured by our platform
The Threads report is the newest solution from Reportei for those looking to monitor, analyze, and enhance their results on the social network launched in 2023.
In a digital marketing landscape that is constantly evolving, being present on emerging platforms can provide both a competitive advantage and unprecedented opportunities for audience interaction.
It was with this potential in mind that Reportei developed the Threads report and dashboard.
Now, professionals, brands, and content creators can rely on essential metrics, automatically captured, and valuable insights to guide decision-making and optimize engagement strategies. Here’s everything you need to know about this new feature!
What is Threads?
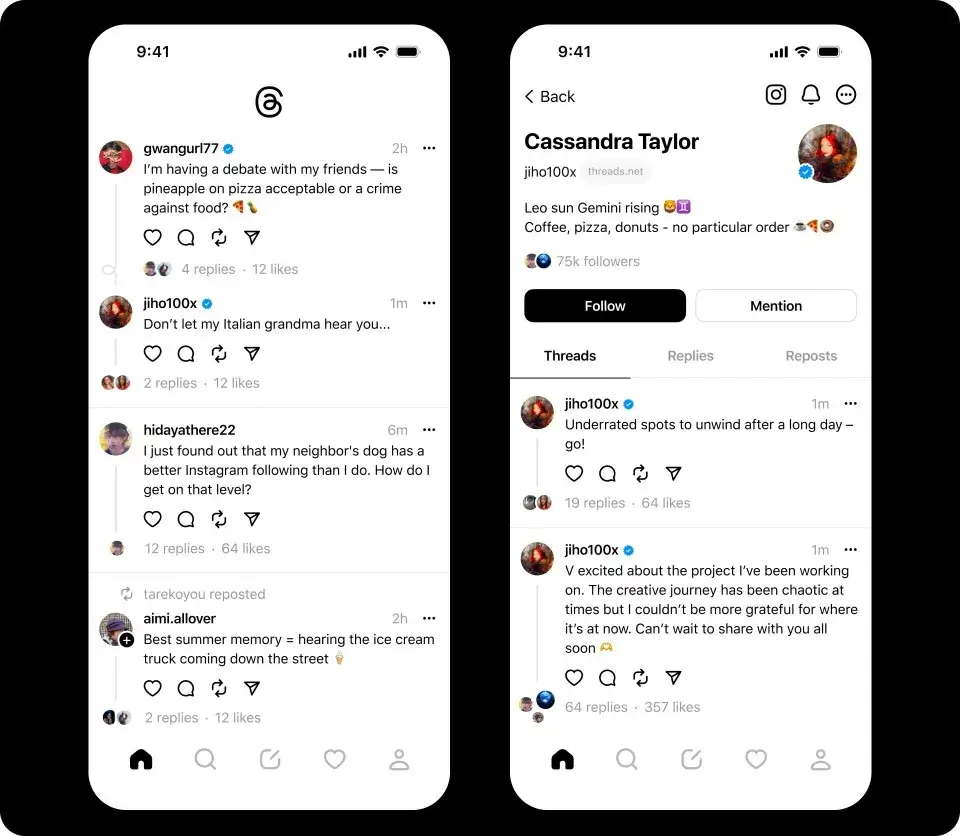
Threads is a social network launched in 2023, focused on providing a more direct and closer experience between friends, communities, and followers.
Unlike other platforms, which work with more complex delivery algorithms, this network prioritizes a chronological timeline, ensuring that users can interact in a more dynamic way without delays in the feed.
In fact, this immediate and continuous exchange experience closely resembles the “microblog” format of Twitter, as Threads also allows the sharing of text, photos, videos, and real-time status updates.
Additionally, another advantage of Threads is its integration with Instagram.
After all, the transition between the two platforms is extremely smooth, allowing users to share stories, posts, and messages without needing to switch apps.
Finally, it’s worth highlighting that Threads shows great potential for businesses and brands looking to strengthen their relationship with the audience.
This is because, by creating more engaged and active communities, conversations become more authentic and personal.
In this context, Reportei’s Threads report stands out, as it delivers valuable data and insights to optimize campaigns and content strategies, while maintaining consistency in branding and engagement with followers.
Discover the Reportei Threads report Our Threads
Report is the latest way to gather, automatically and intelligently, the available metrics from the social network’s insights tool.
In other words, you no longer need to switch between different apps or platforms to compile results and indicators.
On the contrary, simply integrate your Threads account quickly into Reportei, and you’ll have comprehensive reports in just a few clicks.
For those who already use the platform, you may be familiar with the traditional way of accessing data directly on the platform.
You need to open the account, click the last icon on the sidebar, and then select the “Insights” option. There, you can check information like the number of likes, engagement, and reach of posts.
However, with Reportei’s solution, this experience reaches a whole new level of convenience and detail.
This is because, in addition to generating comprehensive reports in seconds, our platform also allows you to analyze Threads results in an integrated way with those from other social media platforms that are part of your digital marketing strategy.
So, instead of spending extra time consolidating numbers from different channels, you get everything in a single dashboard or report, which simplifies understanding the performance of your campaigns. Check out the details below!
Metrics in the Threads
Report By using Reportei to generate your Threads report, you gain access to various metrics that help measure the effectiveness of your actions and identify growth opportunities.
These insights are divided into sections that make it easier to interpret and compare results over time. Here are the main sections:
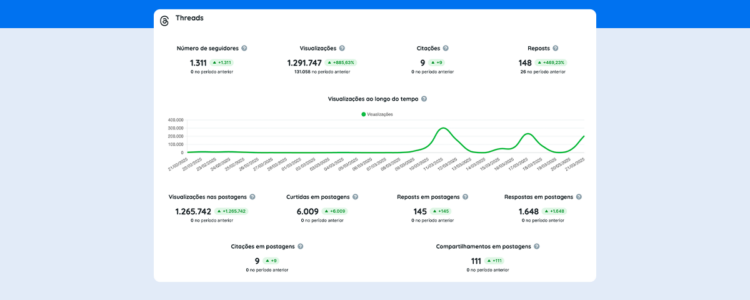
Main Metrics
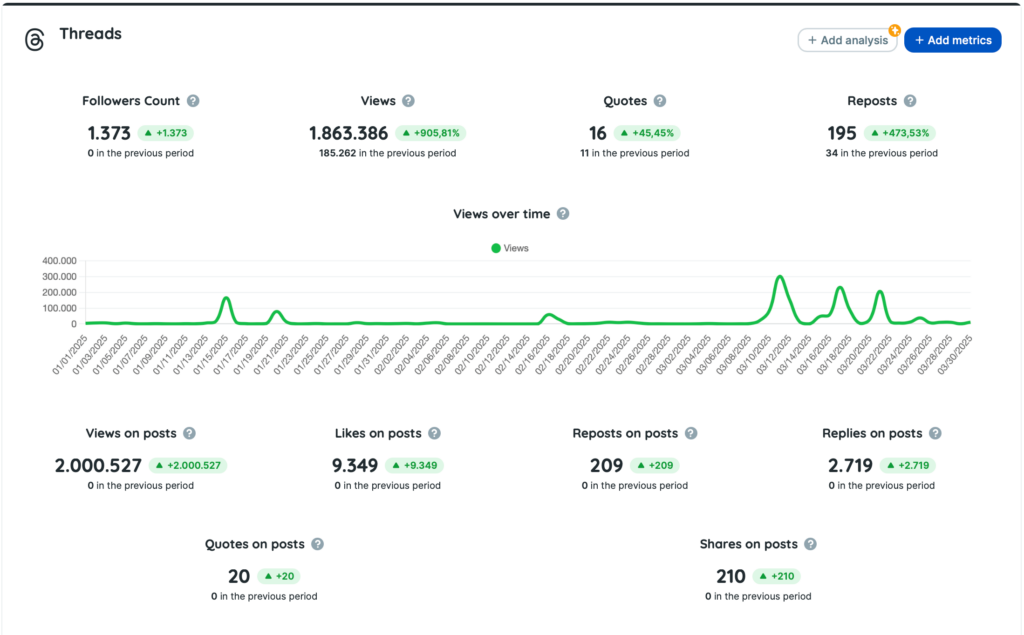
To start, the Threads report highlights the most relevant metrics to understand your performance on the social network. These include:
- Total number of followers: the number of followers who are following your profile, which is essential for understanding your audience base and, most importantly, its growth over time;
- Views: how many people viewed your profile;
- Post views: shows how many views your posts received during the period;
- Mentions: how many times your posts were mentioned;
- Mentions in posts: how many mentions occurred in posts;
- Reposts: measures how many times another user reposted your content;
- Reposts in posts: how many times posts were reshared by other Threads profiles;
- Replies in posts: shows how many replies your posts received, revealing the engagement rate and direct involvement of your audience;
- Likes on posts: how many likes your posts received;
- Shares on posts: how many times your posts were shared by users, increasing the reach of your content.
All these metrics are crucial for understanding how your target audience interacts with the content you produce.
Therefore, they also serve as indicators of trends and opportunities to further boost your growth, both in reach and in your relationship with your followers.
Tables
In the Threads report on Reportei, you’ll also find tables that make reading and interpreting data much more organized. The main ones are:
- Highlighted Posts: shows the posts that performed best in terms of engagement, likes, shares, views, and other relevant indicators for your marketing strategies;
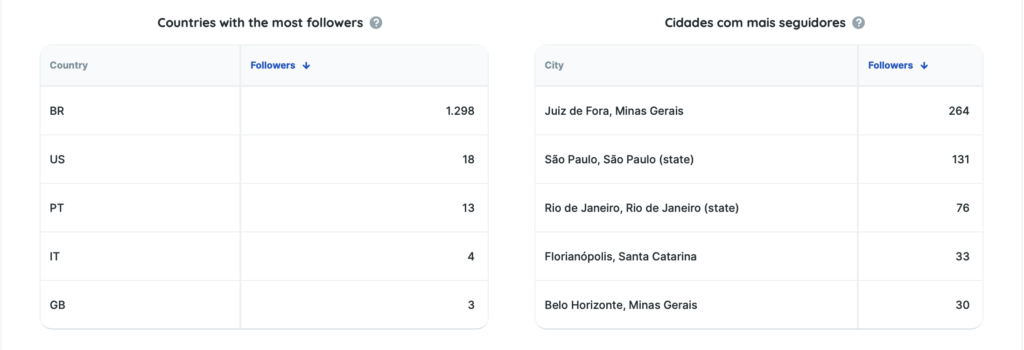
- Cities with the most followers: a list of the top locations where your audience is concentrated, allowing you to tailor your content and campaigns to the specifics and interests of each region;
- Countries with the most followers: just like the city breakdown, this table provides a global view of your audience, showing in which countries your content has the most reach.
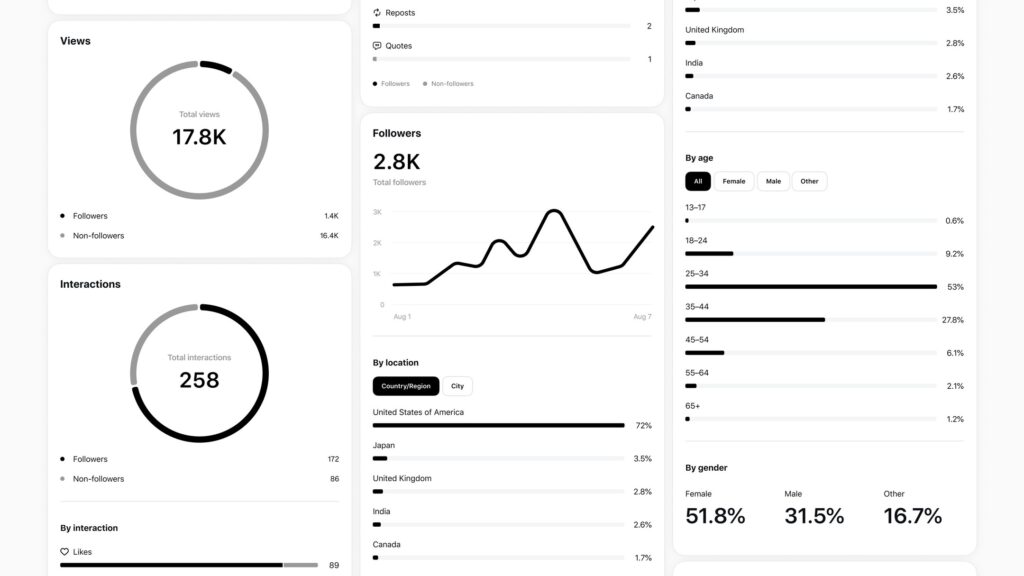
Graphs
To complete, the Threads report on Reportei presents data in the form of graphs that greatly facilitate performance analysis over time. Three examples include:
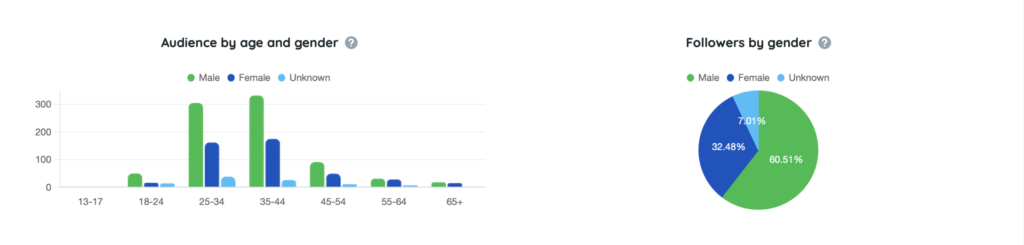
- Audience by Age and Gender: illustrates the age range of your followers and separates the audience by gender, allowing for a deeper understanding of who is interacting with your profile;
- Followers by Gender: a more specific graph focused solely on the distribution of the audience by gender;
- Views Over Time: shows the behavior of views over a given period. This way, you can detect audience peaks related to specific actions, holidays, or particular content.
These graphical insights are essential for anyone needing to plan posts, define relevant topics, or even adjust the language and tone of voice when communicating with the audience.
Make complete social media strategy analyses with Reportei
More than just a Threads report, Reportei offers a wide range of complete solutions to analyze results across all the social media platforms that make up your digital strategies.
Among the key benefits are:
100% customizable professional dashboards:
With Reportei, you can create dynamic dashboards where each metric block can be organized according to your needs.
This allows you to highlight what is truly relevant to your business or your clients’, providing a much clearer and more objective view of the results.
Performance Indicators Dashboard:
The Reportei Control offers an environment that simplifies tracking data and goals, gathering all the essential performance information in one place.
With this dashboard, it becomes easier to monitor the achievement of objectives across various social media platforms, including Threads.
Artificial Intelligence through Reportei AI:
Reportei AI can generate automatic analyses, offering insights and suggestions on the performance of digital marketing channels.
This way, you can identify trends and opportunities much more quickly and make data-driven decisions.
In summary, Reportei was developed to optimize the daily operations of those who need to monitor, measure, and present social media results.
With the integrated Threads report, you gain access to unified, organized data that is ready to be interpreted in moments.
Don’t waste time and stay up to date with this new feature of Reportei: the most practical, intuitive, and intelligent way to turn data into growth opportunities for your brand!