Learn how to generate a Shopify report with Reportei and discover the metrics automatically captured by our platform
The Shopify report has arrived at Reportei to provide complete ecommerce analyses integrated with other marketing channels used in your strategy.
Follow along for everything about the platform, metrics present in the report, and how to make sales monitoring even more efficient in your routine.
Get to know the Shopify ecommerce platform.
The Shopify is a complete ecommerce brazilian platform that allows you to create, customize, and manage virtual stores simply, without needing programming experience.
Furthermore, it offers integration with social networks, marketing tools, inventory management, sales analysis, and much more. Thus, it stands out as a great option for those who plan to have an ecommerce but want to make the process more practical.
Another positive point is that the platform also supports sales across various channels, including physical stores through an omnichannel POS (Point of Sale) system.
Finally, for entrepreneurs, it centralizes operations and finances, making it easier to grow and manage businesses on a global scale.
Integration between Shopify and Reportei
As with any other business model, result analysis is essential to define the best ecommerce strategies on Shopify.
Therefore, having complete reports that integrate marketing and sales data is essential to stand out and get ahead of the competition.
It was with this scenario in mind that the integration between Shopify and Reportei Now it’s possible to analyze all your ecommerce results on a single screen, from the top to the bottom of the funnel, directing your time to what matters most: quick and strategic decision-making.
Next, we’ll tell you all about this novelty: how to start generating Shopify reports with Reportei and the metrics we provide. Let’s go!
How to integrate Shopify with Reportei
The first step to accessing ecommerce reports via Reportei is to integrate Shopify with our platform.
Thus, within our Manage Integrations tab, you should select the network to connect your account. Clicking to integrate will redirect you to the Shopify page, where you should click Install.
If the user isn’t logged in, a window will appear for them to access their account. It will be via this URL that the virtual store will be integrated with Reportei.
Once that’s done, the account will be linked to our platform, and you can generate your complete Shopify report in just a few seconds.
Metrics available in the Shopify report
The Shopify sales report includes a variety of metrics, charts, and tables available in its template. Below, we explain these data and what they mean.
Main metrics
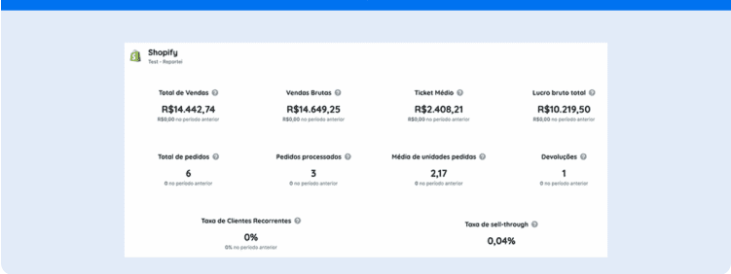
To start, let’s talk about the main ecommerce metrics that are automatically captured by Reportei and are highlighted in the standard report template. They are as follows:
- Total sales refers to the total revenue from gross sales plus shipping, taxes, import duties, and fees, minus the value of discounts and returns.
- Gross sales value of all items purchased before adding taxes or other adjustments like duties, shipping, discounts, or returns.
- Average ticket average value of all orders excluding gift cards, divided by the total number of orders with at least one product that isn’t a gift card.
- Total gross profit is calculated by subtracting the cost from net sales.
- Total orders made across all sales channels.
- Processed orders accumulated number of orders processed and marked as processed during the analysis period.
- Average units ordered during the period.
- Returns: total number of items returned.
- Recurring customer rate percentage of people who placed more than one order in the store.
- Sell-through rate value of all items purchased before adding taxes or other adjustments like duties, shipping, discounts, or returns.
Charts
Along with these data, the Shopify report from Reportei also delivers comparative charts on ecommerce sales over time, such as
- Total sales over time corresponds to gross sales plus shipping, taxes, import duties, and fees, minus the value of discounts and returns.
- Orders over time number of orders placed during the analyzed period.
- Total sales per hour;
- Sales by channel.
Tables
Finally, the Shopify report includes tables that help you see more precisely the results obtained from your ecommerce sales actions. Therefore, you have access to
- Profit by product summary of gross profit performance by product for the selected period. Only products whose costs were recorded at the time of sale are listed.
- Best-selling products includes orders placed across all sales channels.
- Profit by product variant summary of gross profit performance by product variant.
- Sales by traffic source such as paid media, organic, direct traffic, referrals, among others.
- Sales by originating social network total sales resulting from virtual store sessions that originated from social media referrers like Facebook and Instagram.
Learn how to have more accurate analyses in the Shopify report
In addition to automatically capturing metrics and generating complete reports in seconds, Reportei offers a range of features that make your analyses more accurate, such as
- 100% customizable professional dashboards to adapt data visualization to the needs of your virtual store.
- indicator control panel which allows you to monitor all the important project goals.
- artificial intelligence features with Reportei AI to obtain automatic insights from the metrics captured in the report.
As we mentioned earlier, Reportei also integrates analyses from different channels into a single document.
That is, it’s possible to import Shopify data along with more than 20 other platforms like Instagram, Facebook, Meta Ads, Google Ads, TikTok, GA4, and much more.
Just integrate the channels in a few minutes to start capturing metrics and creating reports according to your ecommerce needs. Take advantage of our free 3-day trial to get to know the platform and the integration with Shopify!