Check out 8 metrics that cannot be left out of your paid traffic report and how to analyze them.
The report on paid traffic is an essential tool for developing better strategies for ad campaigns on digital platforms.
After all, with it, you gain valuable insights into investments made in advertising, identifying what works and what needs to be optimized to improve results.
However, for it to be truly efficient, the first step is to understand which metrics are most relevant within the analyses. Therefore, in this article, we will explore 8 indicators that should be monitored and how to interpret them in your reports. Follow along.
What to analyze in a paid traffic report. See 8 metrics.
Whether you work with strategies for Google, Facebook, Instagram, LinkedIn Ads, or other channels, there are always key metrics that help to understand whether the efforts are on the right track or not.
Thus, below, we selected 8 of these indicators that are essential in the paid traffic report to assess the success of your campaigns from the top to the bottom of the funnel. Let’s go.
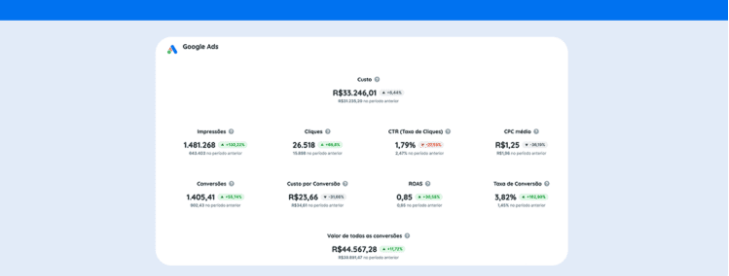
1 Impressions
To begin with, impressions represent the number of times your ad was displayed to users on advertising platforms.
That said, it is a crucial metric to understand the potential reach of your campaign. In other words, a high number of impressions indicates that your ad is being shown frequently, which increases the chances of interaction with the audience.
2 Clicks
Next, we have clicks, which reveal how many times users interacted with your ad by clicking on it to learn more about your offer or visit your site.
Therefore, this indicator is fundamental to measure the target audience’s interest in your promotional content. A significant number of clicks may suggest that the ad is attractive and relevant.
3 Click-Through Rate (CTR)
The Click-Through Rate (CTR) presents the relationship between the two previous metrics. It is calculated by dividing the number of clicks by the number of impressions and multiplying by 100 to obtain a percentage.
With this, it indicates the effectiveness of your ad in generating interest. A high CTR means that a considerable proportion of people who see your ad are clicking on it, which can reflect good targeting and persuasive content.
4 Cost Per Click (CPC)
The Cost Per Click (CPC) shows the average amount paid each time a user clicks on your ad..
Thus, monitoring CPC in the paid traffic report is essential to manage your budget efficiently. If the result is too high, it may be necessary to adjust bids, improve ad relevance, or refine targeting to reduce costs without sacrificing performance.
Check the formula to perform the calculation of this metric.
5 Conversion Rate
The Conversion Rate is also an indispensable metric in the paid traffic report as it indicates the percentage of users who performed a desired action after clicking on your ad, such as making a purchase, filling out a form, or subscribing to a newsletter.
In other words, it goes far beyond analyzing the number of conversions alone and is crucial to assess how effective your campaign is in turning visitors into customers or qualified leads. Its calculation is done as follows.
6 Cost Per Acquisition (CPA)
Along with the conversion rate, it’s important to also consider the CPA, which reflects the average cost to acquire a customer or lead. .
This indicator is calculated by dividing the total spent on the campaign by the number of conversions. Thus, a low CPA means you are spending less to acquire each customer, which increases the profitability of your paid traffic campaign..
CPA = Campaign Cost / Number of Conversions
7 Return on Advertising Spend (ROAS)
Speaking of profitability, the ROAS helps measure the revenue generated for each monetary unit spent on ads. For this, it is calculated by dividing the total revenue obtained from the campaign by the total cost invested in it.
In other words, a positive ROAS indicates that your campaign is profitable. Additionally, monitoring this metric helps understand the overall effectiveness of your traffic management efforts.
8 Quality Score in Google Ads
Finally, when we talk about metrics in Google Ads, the Quality Score allows evaluating the relevance of your ads, , keywords, and landing page. It even directly influences the cost and position of your creatives.
A high score, closer to 10, can reduce the CPC and improve the ad position in search results. Factors such as expected click-through rate, ad relevance, and landing page experience affect this score.
How to interpret the metrics from the paid traffic report to optimize campaigns.
Now that you have checked which metrics are most relevant for the paid traffic report, it is important to emphasize that analyzing them in isolation may not provide complete insights into your campaign’s performance.
Therefore, it is necessary to interpret them in an integrated manner to identify improvement opportunities. Below are three examples of points of attention that the combined evaluation of indicators can demonstrate.
- Low CTR with a high number of impressions your ad is being shown but not attracting clicks. Therefore, consider reviewing the ad text, images, or audience targeting.
- High CPC and low conversion rate you are paying too much for clicks that do not generate results. Thus, assess the traffic quality, the relevance of the landing page, and if the target audience is well defined.
- Negative ROAS your campaign is not generating enough return to cover the costs. Therefore, it is necessary to reassess the overall strategy, including offers, targeting, and messaging.
By correctly interpreting these metrics, you can make precise adjustments to improve the performance of your paid traffic campaigns and achieve better returns with them.
Read also Paid traffic manager: understand what this professional is and does.
How Reportei helps generate more efficient paid traffic reports.
Managing and analyzing all these metrics can be a challenge, especially when working with multiple ad platforms, right? This is where Reportei becomes an indispensable ally, offering solutions that simplify data monitoring and analysis.
In addition to generating automatic paid traffic reports and offering customizable dashboards, our tool has other features that help monitor the main paid traffic metrics in a practical, efficient, and precise manner. Check out the 4 that stand out the most.
- Reportei Sync allows exporting data directly to Google Sheets spreadsheets. This facilitates precise tracking along with other important project indicators, allowing for a more comprehensive and personalized analysis.
- Paid Traffic Management Assistant powered by Reportei AI, combines artificial intelligence and data to identify growth opportunities and suggest adjustments that can improve ad performance across all platforms. It even offers actionable insights to efficiently optimize your campaigns.
- Indicators Control facilitates the monitoring of the most important KPIs in a personalized manner. You can set goals for the metrics and receive alerts when they are reached or fall below expectations.
- Overview: provides a broad and customizable view of the campaigns of all your projects registered in Reportei. This allows you to quickly analyze the overall performance and identify areas that need attention across all channels.
With these resources, Reportei ensures that you have full control over your paid traffic reports, optimize monitoring, and increase the effectiveness of your marketing strategies.
Take advantage now to start your free trial and experience these features in practice