From Defining Objectives to Gaining Insights: Best Tips on How to Start an Effective Digital Marketing Report
If you’re looking for tips on how to start an efficient digital marketing report, this practical guide will help you take the first steps in a structured and straightforward way.
After all, creating a well-organized document with clear objectives is essential for evaluating campaign performance, identifying growth opportunities, and making better decisions for your project.
Below, you’ll find a step-by-step guide covering everything from goal setting to data analysis, along with best practices and tools to make the process more professional and effective.
How to Start a Digital Marketing Report? Step-by-Step Guide
To successfully start a digital marketing report, you need clarity on your goals and the data that will support your conclusions.
By the end of this article, you’ll have a complete overview of each essential step for creating a useful, concise, and relevant report for your team or clients. Let’s get started!
1. Defining Objectives and Goals
Without a doubt, the first step in starting a report is to clearly define the objectives and goals you want to achieve with your digital marketing strategy.
This phase is crucial to guide the data collection and analysis process, ensuring that your report is not just a list of disconnected metrics. Here’s what to define:
- Main Objective: Identify what you want to analyze in the project, such as brand visibility or lead generation. This core objective will serve as a guiding principle for all the next steps.
- Specific Goals: Break down the main objective into smaller, time-bound goals with clear success metrics. For example, if your goal is to generate more leads, a specific target could be “increase the number of qualified leads by 20% in the next quarter.”
- Business Alignment: Ensure that all goals are aligned with the overall business strategy of your company or client. There’s no point in setting overly ambitious targets if they don’t make sense within the business context.
By taking this first step, you’ll have more confidence in selecting the right metrics, defining the analysis period, and structuring the final format of your report.
2. Choosing Relevant Metrics and KPIs for Your Report
Next, it’s time to select the key performance indicators (KPIs) and metrics that truly matter for tracking progress and measuring the success of your project:
- KPIs aligned with objectives: For example, if the goal is to increase lead generation, focus on tracking new contacts generated, conversion rates, or cost per lead (CPL).
- Avoid vanity metrics: Likes and views may seem impressive, but they don’t always translate into business impact. Instead, prioritize data that provides actionable insights.
- Establish benchmarks for comparison: Finally, always contextualize your selected metrics by comparing them to previous periods or market benchmarks. This helps determine whether your results are above, below, or within expectations.
Remember: Less is more. A report overloaded with irrelevant metrics can cause confusion instead of providing clarity. Focus on key insights that directly answer your client’s most pressing questions.
3. Tools and Processes for Data Collection
To start creating a digital marketing report, you need access to performance data.
This data collection can come from multiple sources, and having the right tools makes a significant difference. Consider the following:
- Primary Data Sources: Use Google Analytics to track website traffic and user behavior, and leverage native platform tools (such as Meta Ads and Instagram Insights) to analyze your advertising and content strategies.
- Organizing Information: Gather all data in a centralized location to avoid confusion. While manual spreadsheets can be an option, they may become time-consuming if you manage multiple accounts and channels.
- Automating Data Collection: Use tools like Reportei to integrate different platforms, automate data extraction, and reduce errors during collection. In just a few clicks, you can gather all key metrics, saving time and ensuring accuracy.
Automating the data collection process not only accelerates report creation but also allows you to focus more on analysis and optimization strategies.
4. Structuring the Report
Once you have gathered all the necessary data, it’s time to structure the document itself, defining its sections and how the information will be presented.
Knowing how to start writing a report also involves planning the layout to ensure clarity and ease of understanding. You can follow this structure:
- Introduction: Present the objective of the report, the analysis period (e.g., monthly, quarterly, or semi-annual), and any key information to provide context for the reader.
- Summary: Highlight the key results and insights concisely, so decision-makers can get a quick overview of the report.
- Detailed Analysis: Include charts, tables, and explanations of the most relevant results. Organize data by channel or objective, depending on what makes the most sense.
- Conclusions and Recommendations: After analyzing the data, present key learnings and suggestions for next steps.
- Appendices: If necessary, include more detailed reports as attachments, avoiding clutter in the main document.
Having a clear and well-organized structure is essential to communicating complex information in a way that is accessible to all stakeholders.
5. Initial Data Analysis and Identifying Patterns
With the data collected and the structure pre-defined, the next step is to dive into the numbers to find patterns, trends, and potential issues that may impact your objectives.
- Assess whether current performance is improving or declining compared to previous periods. This helps determine whether recent actions had a positive or negative impact.
- Identify significant spikes or drops in performance, as these may indicate technical issues, shifts in audience behavior, or external market changes.
- Segment the data whenever possible (by demographics, behavior, or channels) to discover which groups are responding best to your campaigns.
This initial analysis serves as the foundation for generating deeper insights in the next step. The better you understand patterns and trends, the more precise your recommendations will be.
6. Turning Data into Actionable Insights
One of the key differences between a basic marketing report and one that provides real value is the ability to transform data into actionable insights.
After all, what’s the point of a report if it doesn’t point to practical next steps? To develop a strategic document, consider these points:
- Align findings with business objectives: Revisit the goals set at the beginning and assess whether the results show progress or indicate the need for adjustments.
- Ask “Why?”: Whenever you see a significant variation, investigate the underlying cause. Was there a budget shift? Did competitors intensify their campaigns? Was there a change in audience segmentation?
- Provide clear recommendations: Suggest specific actions, such as increasing or decreasing investment in certain channels, testing new audience segments, or adjusting ad creatives. These recommendations make the report more strategic and actionable.
By analyzing data effectively, you create a solid foundation to propose adjustments, optimize campaigns, and drive better results, always keeping business goals in focus.
7. Best Practices for Presenting the Report
Finally, beyond the content itself, a well-structured digital marketing report must also be presented effectively. A confusing or visually unappealing document can discourage engagement and make interpretation difficult.
Consider the following best practices:
- Clean and consistent design: Use charts and tables to illustrate key points but avoid cluttering the layout with excessive information.
- Objectivity: Get straight to the point, highlighting the most relevant numbers and explaining them in simple language. For deeper analysis, include appendices and keep the main body focused on insights.
- Storytelling: Create a logical flow in your narrative. Start with objectives, present the numbers, then explain how they were achieved and what can be done next.
- Regular reporting frequency: Define how often the report will be delivered and stick to that schedule so that all stakeholders can track progress over time.
A clear, visually consistent, and well-structured report enhances credibility and facilitates decision-making.
Use Reportei to Create More Professional Reports
Now that you know how to start a digital marketing report, it’s worth exploring Reportei, a tool that simplifies the entire process, from data collection to final document formatting.
With our platform, you gain access to several benefits, including:
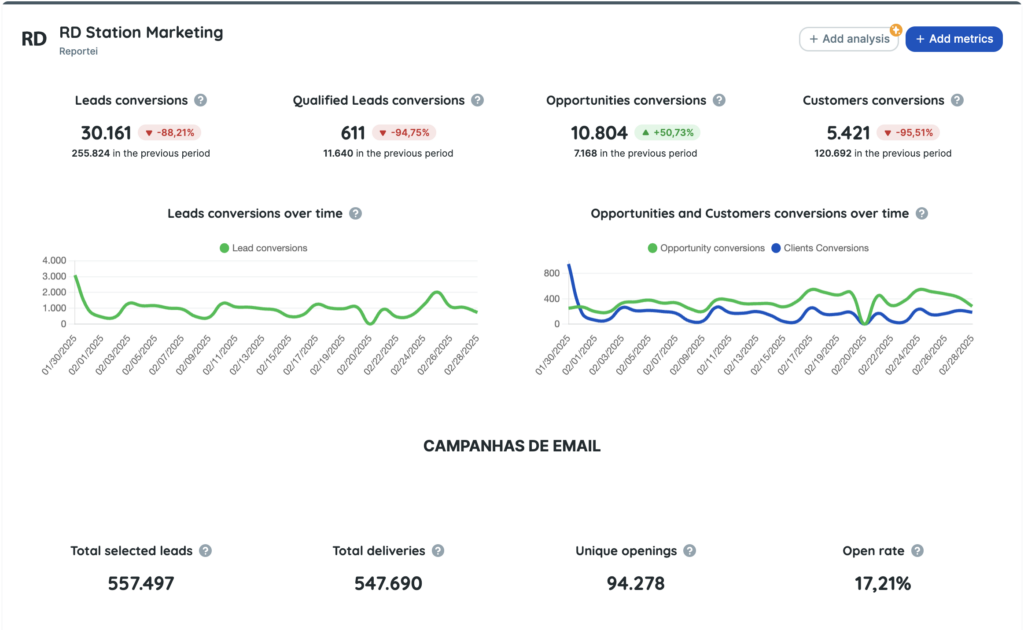
- Direct integration with over 20 channels: Instead of manually accessing Google Analytics, Google Ads, Meta Ads, and other accounts, Reportei consolidates all data into a single dashboard, saving time and reducing errors.
- Automated reports: With just a few clicks, you get ready-to-use charts and organized key metrics. This allows you to focus on data analysis rather than spending time gathering information.
- Customization: Reports can be tailored to match the company or client’s brand identity, highlighting the most relevant insights and creating a professional layout.
- Easy sharing: Reports can be sent directly to clients or project stakeholders, ensuring that everyone has seamless access to the data.
Choosing a solution like Reportei not only streamlines the report creation process but also adds a professional touch and enhances the reliability of the data presented.
Try Reportei for free for 3 days and see how it can revolutionize the way you create digital marketing reports!