Know which metrics to analyze in the ecommerce report and how to turn this data into sales strategies
The ecommerce report is an essential tool not only for extracting insights about the store’s current performance but also for obtaining clear guidelines on how to increase sales sustainably and scalably.
However, for it to be truly effective, it is necessary to know which indicators to follow and how to transform this information into new strategies.
Thus, we have prepared this guide to assist in the process of creating and interpreting the ecommerce report with tips to enhance your results through data. Follow along below.
The Importance of data in ecommerce
In the information age, data is considered the greatest treasure any entrepreneur can have, and when we talk about ecommerce, this scenario is no different.
After all, the metrics collected from customer interactions with the virtual store are an endless mine of insights that, when explored correctly, can lead to significant growth in sales and revenue.
Moreover, data-driven decision-making is an essential part of the data-driven culture allows managers to identify trends, understand consumer behavior, and adjust strategies in real-time.
Without this approach, companies risk making decisions based on assumptions or intuitions, which can result in missed opportunities and wasted resources.
Moreover, in an environment where consumer preferences change rapidly and new technologies constantly emerge, data provides the agility necessary to adapt and remain competitive.
In other words, they allow personalizing the customer experience, optimizing operations, and maximizing the return on investment (ROI) as we will show in more detail below.
Key metrics to monitor in the ecommerce report
But to extract valuable insights from the data, it is fundamental to know which metrics should be monitored.
Thus, we will explore in detail 5 indicators that cannot be missing in the analysis of your ecommerce report. Let’s go!
1 Conversion Rate
The conversion rate is one of the most critical metrics in ecommerce as it indicates the proportion of site visitors who make a purchase.
That said, a low conversion rate may indicate problems with site usability, lack of customer trust, or unattractive offers.
Thus, to reverse this scenario, it is important to examine each step the customer takes before making a purchase to identify where drop-offs occur.
Moreover, it’s important to keep an eye on technical issues of the site. For example, slow pages can frustrate users and increase the abandonment rate.
2 Average Ticket
Meanwhile, the average ticket represents the average amount spent per transaction in your store In other words, it is calculated by dividing the total revenue by the number of orders in a specific period.
One of the major challenges for merchants is obtaining better results with this metric. However, there are several strategies that can be adopted such as:
- Upselling and cross-selling, offering complementary products or premium versions of items in the cart
- Volume discounts that encourage purchases in larger quantities by offering progressive discounts
- Free shipping above a minimum value sets a minimum purchase amount for the customer to get free shipping, encouraging them to add more items to the cart
3 Cart Abandonment Rate
The cart abandonment rate is also an essential metric for the ecommerce report as it indicates the percentage of customers who add products to the cart but do not complete the purchase.
Thus, this is a critical area as it represents potential lost sales. To reverse this scenario, it’s important to simplify the checkout process as much as possible and work with sending emails that encourage customers to complete the purchase of items left in the cart.
4 Customer Acquisition Cost (CAC)
The CAC calculates how much the company spends on average to acquire a new customer Its formula divides the total marketing and sales costs by the number of new customers acquired in a period.
Therefore, having a reduced CAC is the goal of any ecommerce. For this, it is necessary to optimize the marketing campaigns that attract customers to the site and, of course, improve the conversion rate.
5 Return on Investment (ROI)
Finally, the ROI assesses the financial return obtained in relation to the investments made in marketing and sales. In other words, it is an essential metric to understand the effectiveness of the strategies implemented.
The maximization of ROI can be achieved through various actions such as:
- Identifying which campaigns generate more revenue to optimize or eliminate the less effective ones
- Using tools that automate repetitive tasks, allowing focus on strategic activities
- Alignment between marketing and sales teams to ensure both departments work in synergy and increase the efficiency of the sales funnel
How to turn data into sales strategies
Now that you know the most important metrics of the ecommerce report, it’s important to know that accessing the data is just the first step.
After all, the true differentiator lies in interpreting them correctly and turning them into practical actions that drive sales. Thus, we have selected below 6 strategies on how to convert insights into tangible results.
Advanced customer segmentation
To start, use the data to create detailed segments of your customer base. This can include:
- Purchase behavior purchase frequency, amount spent, and preferred product categories
- Demographics and geolocation age, gender, geographic location, language
- Engagement interactions with emails, social networks, and time spent on the site
From there, you can develop personalized campaigns for each segment, which increases relevance and conversion rate. Additionally, use algorithms to suggest products that align with the specific interests of each group.
Continuous optimization of marketing campaigns
Data enables a constant cycle of testing, learning, and adjusting marketing campaigns that bring new users to your site.
With this, you can assess performance across different channels, email, social networks, SEO, paid traffic to identify which provide better ROI and direct investments more efficiently.
Inventory management
Sales data and customer behavior are essential for effective inventory management. This is because they help in having a demand forecast according to seasonality and avoid stockouts.
Along with this, it is possible to focus efforts on the most valuable items and identify slow-moving products to create strategies to move them, such as more attractive promotions for customers.
Improvement of user experience
Site usability has a direct impact on sales. Therefore, navigation data can reveal opportunities to improve user experience and prevent issues like low conversion rate or cart abandonment.
For this, it is essential to analyze in the ecommerce report how users navigate conduct surveys to understand their perceptions and always invest in a responsive design that works well on all devices, especially on mobile.
Strategic pricing
Data-driven pricing allows adjusting prices according to demand, competition, and other factors.
Thus, it is necessary to understand how price changes affect demand for your products and from there plan specific discounts for segments or potential customers based on their behavior.
Automation and artificial intelligence
Finally, advanced technology can help process large volumes of data and automate actions With this, it is possible to:
- Use AI to personalize recommendations and communications for thousands of customers simultaneously
- Implement chatbots that use data to provide quick and accurate responses
- Conduct predictive analysis of future trends based on historical patterns
Regardless of which actions are taken, it is worth noting that turning data into sales strategies is an ongoing process that requires adequate tools and a data-oriented culture within the organization.
How Reportei assists in generating efficient ecommerce reports
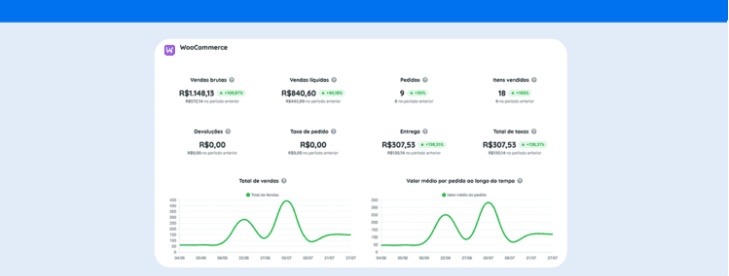
Speaking of suitable tools, the Reportei is a complete solution that facilitates the collection, analysis, and interpretation of your ecommerce report data. This is because we offer:
- Integration with major market platforms such as WooCommerce, Shopify, and Nuvemshop consolidating all data in one place
- Preconfigured templates to meet ecommerce needs, in addition to the possibility of customizing the layout
- Reportei AI that offers instant insights through artificial intelligence, helping you quickly understand the most relevant points of your data
- Dashboards to monitor campaigns in real-time to manage all traffic, SEO, social media, and sales channels indicators in a single intuitive panel
- Monitoring of indicators to know if the campaigns are close to achieving their goals
By centralizing and simplifying data analysis, Reportei allows you to focus on what really matters: developing effective strategies to increase sales in ecommerce
Take advantage of the free trial of the tool and discover how we can revolutionize the way you manage and expand your online business.